User Activation Rate: Formula, Benchmarks, and Fixes
Why published user activation rate benchmarks disagree by 7.4x, the formula to calculate yours, and a data-driven way to pick your activation event.

On this page
User activation is the metric growth teams argue about most: two companies can publish an "activation rate" that differs by roughly 7.4x while describing different things. One measures a company's own defined event tracked in the product; the other applies a standardized proxy the same way to every product. That gap compounds with a separate window effect, so a bare percentage means nothing until both are named.
What is user activation? (and how it's different from acquisition, adoption and engagement)
User activation is the point where a new signup first completes an action that proves they experienced a product's core value, a distinct event from simply acquiring, adopting or engaging with it. It's the second stage of Dave McClure's AARRR pirate metrics framework, the "A" right after Acquisition. Getting someone to sign up tells you nothing about whether the product actually worked for them.
If you searched for "user activation" as a browser or JavaScript concept, the platform API that gates autoplay and pop-ups, that's a different, unrelated topic with no growth metric attached.
The four terms get used almost interchangeably in growth conversations, and that's the actual problem. A team can spend a quarter pushing engagement up (more logins, more session time) while activation, whether new users ever get value in the first place, stays flat.
Activation matters beyond being a number to report upward. Amplitude found that 69% of its top 7-day activation performers were also top performers in 3-month retention. Retention itself compounds: Reichheld and Sasser's 1990 Harvard Business Review study found that cutting the customer defection rate by five percentage points raised profits by 30% to 85% across the service businesses they studied.
The table below separates the four questions so a metrics review doesn't quietly answer the wrong one.
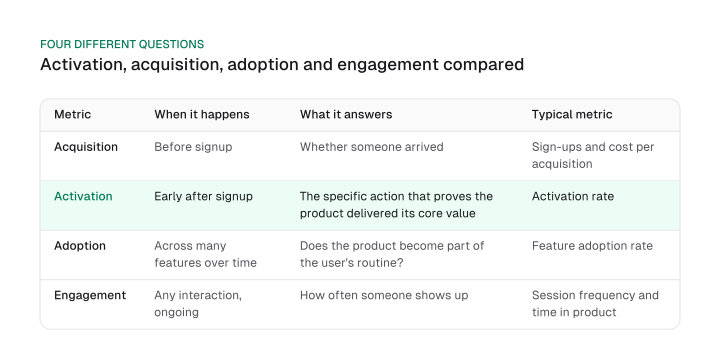
Each term answers a different question, and mixing up any two of them means optimizing for the wrong number:
- Acquisition: happens before signup, and only tracks whether someone arrived, measured by sign-ups and cost per acquisition.
- Activation: a one-time question early after signup, tracked by activation rate; it looks for the specific action that proves the product delivered its core value.
- Adoption: unfolds across many features over time, tracked by feature adoption rate. Does the product become part of the user's routine?
- Engagement: covers any interaction, ongoing, tracked by session frequency and time in product. It counts how often someone shows up, not what they do once there.
Confusing any pair of these produces the wrong fix. A person can be acquired and never activate, can activate once and never adopt the product beyond that first feature, or can engage heavily, with frequent logins and long sessions, without ever having activated at all. That last gap is why a re-engagement campaign sometimes lifts engagement numbers for people who never got real value.
The activation vs adoption comparison in the table above is the pair growth teams confuse most often. Adoption tracks whether a user keeps incorporating the product into their workflow across many features, not whether they crossed the single early bar that counts as activation.
Activation isn't limited to the first week, either. Every new feature a product ships creates its own smaller value moment, the first time a user tries that feature and gets, or doesn't get, its payoff. So a single activation metric measured only at signup misses real risk to retention and expansion later on.
Choosing your activation event: setup, aha and habit moments
A good activation event is a specific, measurable action, not a vague milestone like "completed onboarding." It comes from one of three moments:
- Setup: the point where a user configures the product around their own data, such as connecting an account, importing a contact list or uploading a file. It shows they've invested enough to want the product working.
- Aha moment: the instant a user sees the product's core value directly, often through a preview or a generated result.
- Habit: the point where an action starts repeating on its own, without needing a prompt.
Some teams call the aha moment the "wow moment" instead: both names describe the same instant of realization. What matters is the difference between that instant and activation itself: it's a feeling, while activation is the specific, measured event or rate you define around it.
Picking the wrong moment produces an event that looks fine on a dashboard but predicts nothing. "Completed onboarding" is a checkbox a setup flow can force a user through: clicking next four times proves nothing about whether the user experienced real value. The right action is the one that meaningfully raises the odds a user sticks around once it happens.
A good activation event should also happen soon after signup. The faster a new user reaches it, the more of that signup cohort is still around to be measured. How fast is fast enough for a given product is a separate question about time to value.
The historical example most growth teams cite here is usually cited wrong. In an October 2012 talk, Facebook growth lead Chamath Palihapitiya said the number his team found was seven friends in ten days. That's different from the "10 friends in 14 days" figure that keeps getting copied from page to page in growth content.
When a competitor's number sounds neat and comes with no source, checking it against the primary talk is worth the extra step before repeating it. Facebook's growth team treated that figure as a specific, testable hypothesis about which action correlated with retention, rather than an onboarding checklist item. Copy the method, not the number: your product and user base aren't Facebook's.
How to calculate your user activation rate
The user activation rate formula compares users who reached your defined event against total new signups, then turns that ratio into a percentage. But the window you choose changes the answer.
Activation rate (%) = (activated signups ÷ total new signups in the period) × 100
That formula hides more than it reveals until you fix a measurement window, because the same cohort produces a different rate depending only on how long you wait to count it.
Take a cohort of 1,000 new signups tracking the same defined activation event. Measured at day 7, 220 of them have completed it, for a 22.0% activation rate. Measured at day 30, with nothing else about the cohort or the event definition changed, 310 have completed it: a 31.0% rate. Only the cutoff moved between those two numbers.
It's the same mechanism that quietly moves a content ROI number. Pick a different attribution rule for what counts, and a metric that looks like plain arithmetic on the surface produces a materially different answer underneath.
Whatever window you pick, name it every time you report the rate. A bare percentage with no stated window isn't comparable to anyone else's, including your own from a different reporting period.
User activation rate benchmarks, and why they disagree by 7.4x before the window even changes
Published user activation rate benchmarks disagree by roughly 7.4x on the same day-one window because they measure two different things: a company's own defined event tracked in-product, and Amplitude's standardized return-by-day proxy. Window choice alone adds another 2.5x on top of that.
Userpilot's own numbers put the median user activation rate at 37.04% (37.5% average), based on 62 B2B SaaS companies' Activation Dashboards as of September 2025. Each of those companies measured its own, self-defined activation event.
Amplitude's benchmark measures something structurally different: a standardized day-1 return rate applied identically to every product, drawn from anonymized data across more than 2,600 companies collected between September 2023 and September 2024. Amplitude puts the median day-1 rate at about 5%, with top-10%-percentile products reaching about 21%, already a more than 4x spread inside Amplitude's own data before any comparison to Userpilot.
Those two families aren't interchangeable. Userpilot's sample self-selects toward companies mature enough to already run onboarding-analytics software and to have defined their own activation event. Amplitude's is a population-level proxy that doesn't know or care what a product's real value moment is.
Divide Userpilot's 37.04% median by Amplitude's 5% day-1 median and the gap is about 7.4x: a definition gap, not a real difference in how well companies are performing.
A second, independent gap shows up inside Amplitude's own data. Its day-14 median activation rate drops to about 2% (top performers, about 9%), roughly 2.5x lower than its own day-1 median. This is a window effect that compounds with the definition gap rather than replacing it.
Multiply the 7.4x definition gap by the 2.5x window gap and you land close to the roughly 18.5x difference between Userpilot's median and Amplitude's day-14 median specifically. Both numbers matter on their own: quoting only the compounded ratio, without saying which part is definition and which is window, gives you nothing to check your own number against.
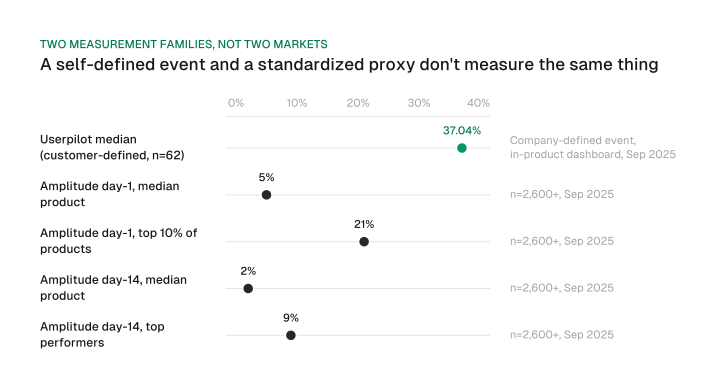
Before comparing your own rate to a published number, ask which family that number belongs to: a customer-defined event each company tracks in its own product, like Userpilot, or a standardized proxy applied uniformly, like Amplitude. Then ask what window it used.
Skipping either question is how a self-defined activation rate ends up unfavorably compared against Amplitude's population-level day-1 median, a number that was never measuring the same thing in the first place.
One more reason to check sourcing before trusting a number: kompassify.com presents "37.5%... median around 30%" as its own "2025 benchmark data," with no named methodology. Those figures match Userpilot's published numbers almost exactly, uncredited. A benchmark that won't show its work is exactly the kind this audience has already been burned by.
Activation rate is typically also one of the input metrics a north star metric gets decomposed into. Which means a stated definition and window matter for one more reason: the same imprecision that makes benchmarks incomparable makes a north-star decomposition unreliable too.
Finding your activation event from your own data
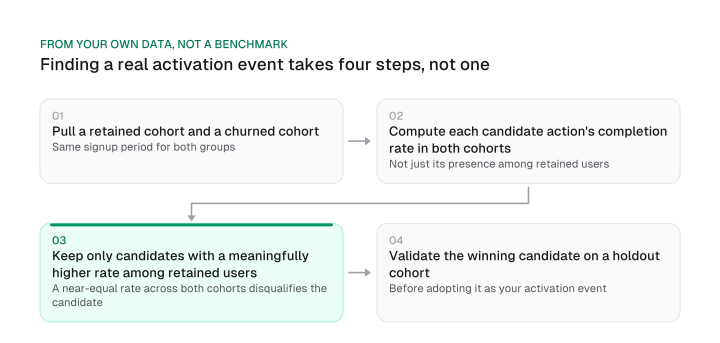
Finding your real activation event means comparing what your retained users did in their first session against what your churned users did in theirs. It's not enough to catalogue what your successful users happened to do alone. Turn that comparison into a decision with four steps.
Start by pulling a retained cohort and a churned cohort from the same signup period, so the comparison isn't skewed by a product change or a different acquisition channel between the two groups. Then compute each candidate first-session action's completion rate in both cohorts: the share of each group that completed it, rather than a simple presence check among retained users.
Keep only the candidates with a meaningfully higher completion rate among retained users. A near-equal rate across both cohorts means the action doesn't separate who stays from who leaves, no matter how common it looks among your successful users alone. Finally, validate the winning candidate on a holdout cohort before adopting it as your activation event, to confirm the pattern holds outside the data you used to find it.
Step 3 exists because of a specific, well-documented mistake known as survivorship bias. During World War II, military analysts studying returning bomber aircraft wanted to reinforce the areas of the plane showing the most bullet damage.
Statistician Abraham Wald argued the opposite: the parts of the plane with the fewest hits on returning aircraft were the most dangerous to get hit, because a hit there was too often fatal for the plane to make it back and get counted. Mangel and Samaniego's paper in the Journal of the American Statistical Association documents how Wald turned that missing data into per-part risk estimates.
Checking only what your retained users did repeats the same error. A candidate action common among the users who stayed tells you nothing until you've checked whether churned users did it just as often, because the users who'd disprove it never showed up in a retained-only cohort.
This check only rules out a false positive: it tells you a candidate is wrong, not which one is right, and it needs data from users who already churned, so a product too new to have lost anyone can't run this step yet.
In practice, that means pulling both a retained and a churned cohort and comparing completion rates side by side, not treating retained-user behavior alone as evidence that an action belongs in your metric. Run those four steps on any candidate before you adopt it, and you're defending your activation event with a comparison, not a guess.
Improving your user activation rate
Raising your user activation rate means shortening the path to your defined event, guiding users to it in-app, and personalizing that path only when it's actually warranted by real behavioral differences between user types.
Shortening the path starts with removing steps between signup and the activation event that don't need to be there. Every optional field, every intermediate confirmation screen, every step a user has to clear before reaching the value action is a place a signup can drop out of the funnel before it ever gets counted.
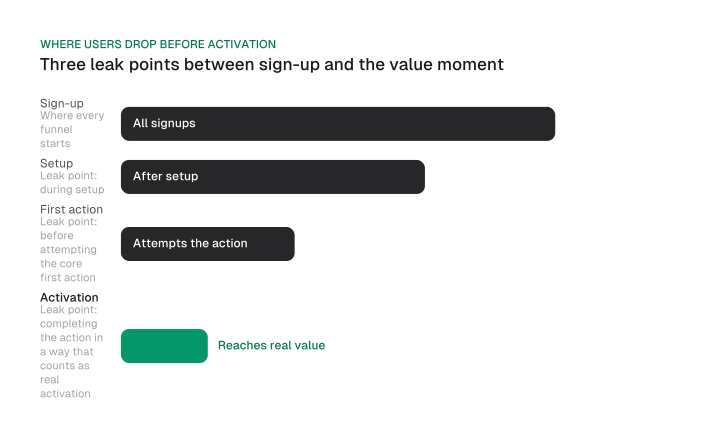
Most funnels start at sign-up and leak at three points after that: during setup, before the user ever attempts the core first action, and between attempting that action and completing it in a way that counts as real activation.
Guiding users to the event in-app, through checklists, progress indicators or contextual prompts triggered by inactivity, works because it replaces a user's own guesswork with a direct path to the one action that matters. Incentives and light gamification, like progress bars or small unlocks tied to completing the activation event, pull the same lever for users who respond better to a visible reward than to guidance alone.
Personalizing that path is where teams overspend. It's worth its engineering cost only when at least two user archetypes need genuinely different first-value actions, not different vocabulary or branding wrapped around the same action.
Otherwise a single best path outperforms segmentation, because every fork adds a decision point most users didn't need. Before building a personalized flow, confirm the archetypes you're building it for actually complete different actions to reach value, not personas that only read differently on a slide.
Users who stall partway through the funnel are worth a separate nudge rather than being left to next cohort's numbers. A targeted message referencing the specific next step, rather than a generic "come back," can recover some of that drop-off.
This kind of tactic belongs on a growth experiment cadence: a weekly-tested backlog, not a checklist a team runs once and stops measuring.
A user activation rate on its own isn't a fact you can compare against a blog post. It only means something once you can say which event you measured, what window you used, and whether the benchmark you're checking it against comes from the same kind of measurement.
Name your event and its window next to any rate you report. Then run the four-step method above against your own retained and churned cohorts before you trust that the event you picked is the right one.
Frequently asked questions
What is the difference between user activation and user engagement?
Activation is a one-time value-realization event: the moment a new user first experiences the product's core value. Engagement measures ongoing interaction frequency, and it can rise from re-engagement nudges even for users who never activated in the first place. A user who logs in daily without ever reaching the value moment counts as engaged even though they never activated.
Is "sticky" or "transient" user activation the same thing as this metric?
No. That's a separate browser and JavaScript platform concept: a page-interaction gate that determines whether autoplay or pop-up permissions are allowed. It has nothing to do with the product-growth metric.
What tools can help improve user activation?
Three categories do this job: product analytics and funnel tools to find and measure the event, in-app onboarding and guidance tools to shorten the path to it, and session-replay tools to see where users get stuck along the way. None of them replace the step of defining the event first. A tool can measure or guide toward an activation event, but it can't pick the right one for you.
What are examples of user activation events by product type?
A project-management tool might treat activation as building a first project and adding a collaborator. A CRM might tie it to loading a contact list and closing a first deal. An analytics tool might define it as linking a data source and pulling up an initial report. Each example is specific and measurable, mapped to the moment that product's core value becomes real for a new user.
Is user activation only relevant during onboarding?
No. Every new feature creates its own smaller activation challenge, so feature-level activation keeps mattering for retention and expansion long after initial onboarding ends. A user who activated on day one can still fail to activate on a feature shipped a year later.
Figures and images in this post are free to reuse under CC BY 4.0 with credit to Mission Growth.
Get Mission Growth highlighted in your Google results.