B2B Marketing KPIs vs. Metrics: How Many You Need
B2B marketing KPIs worth reporting: one head metric and one guardrail per funnel stage, and the MQL-to-SQL benchmark two guides disagree on.

On this page
Most B2B marketing KPI dashboards borrow a fifteen-line checklist from someone else's blog post and never cut it down.
B2B marketing KPIs worth a board's attention are a smaller set: one head metric and one guardrail metric for each of three funnel tiers, activity, pipeline and revenue.
This guide sorts the B2B marketing metrics that earn a line on that dashboard from the ones that only look busy, and applies the same discipline to B2B SaaS marketing KPIs, where sales and marketing share one lifecycle-stage record.
In this guide:
- The four-condition test that separates a real KPI from an activity number
- Why a rising activity metric and a flat pipeline aren't a contradiction
- The pipeline-tier math that can flip a cost-per-lead ranking
- Marketing-sourced vs. marketing-influenced revenue, reported as two lines
- A six-line dashboard: one head metric and one guardrail per funnel tier
What are B2B marketing KPIs, and how are they different from a metric?
A B2B marketing KPI is a metric with four conditions attached: a named objective, an accountable owner, a threshold, and an operational definition.
Most lists stop at the first three. The fourth means two teams must compute the same number from the same event.
Only 23% of marketers say they're confident they're tracking the right KPIs, per a 2021 survey of more than 200 businesses by Ruler Analytics.
HubSpot's own lifecycle-stage property shows why that fourth condition matters more in B2B than in B2C. The property holds eight sequential values on one contact or company record: Subscriber, Lead, Marketing Qualified Lead, Sales Qualified Lead, Opportunity, Customer, Evangelist, Other.
A marketing qualified lead (MQL) and a sales qualified lead (SQL) are simply two states of that single property. An MQL-to-SQL rate is only comparable across teams once both sides agree on the exact point where the property's value changes.
A B2C KPI usually tracks one action on one channel a single team owns. A B2B KPI tracks a state change on a record that marketing, sales and often a CRM admin all touch, which is where the same-name-different-number problem starts.
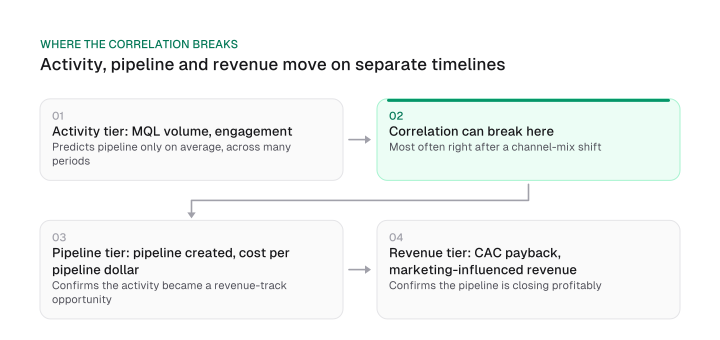
Here's the test, in table form:
| Condition | What it checks | Fails without it |
|---|---|---|
| Named objective | Ties to a specific business goal, not "growth" in general | The number carries no weight in any decision |
| Accountable owner | One named team or person answers for it | Nobody explains a bad quarter |
| Threshold | A target that says pass or fail | Every result reads as "fine" |
| Operational definition | Two teams compute the same value from the same event | Marketing and sales report different SQL counts from the same pipeline |
Search marketing runs into a version of this same problem; see SEO KPIs for the three-condition test (goal, owner, threshold) applied to search specifically. B2B marketing needs a fourth condition on top of that because the record a B2B KPI is built on is shared, sequential and easy to disagree about without anyone noticing.
Activity-tier KPIs, and why a healthy dashboard can hide a flat pipeline
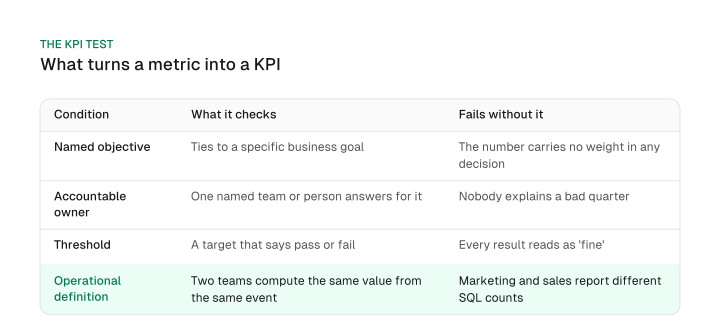
An activity-tier KPI, MQL volume, session count, content engagement, predicts pipeline only on average across many reporting periods. A single period's activity gain carries no guarantee that the correlation held this time, especially right after your channel mix shifts.
Say your MQL volume climbs after a new content push, while pipeline created stays flat that same quarter. Two different tiers are moving on two different timelines here.
Part of the problem lives inside the numerator itself. A session count that doubles when one visitor switches from phone to laptop, or an MQL count that never dedupes a lead who filled the same form twice, inflates the activity number without changing anything downstream. The pipeline-tier guardrail catches that inflation before it reaches a board slide, because a deduped, real opportunity either shows up there or it doesn't.
It isn't enough to measure the final outcome alone... you also need to track intermediate metrics to understand where consumers might be getting stuck.
The fix pairs that activity metric with a pipeline-tier guardrail. A break between the two tiers then shows up on the dashboard instead of hiding behind a chart that only ever climbs.
This is a different measurement problem from AI search visibility KPIs, which track whether an AI engine cites your brand at all. A marketing-sourced or marketing-influenced revenue KPI here never conflates with an AI-visibility score; they answer different questions about different systems.
Pipeline-tier KPIs: pipeline contribution, cost per pipeline dollar, and win rate
Pipeline contribution percentage and cost per pipeline dollar answer a question cost-per-lead can't: is marketing's activity actually becoming revenue-track opportunities. Cost-per-lead stops counting the moment a lead exists.
Cost per pipeline dollar, everything marketing spent divided by what that spend produced, keeps counting through the point where a rep opens the opportunity.
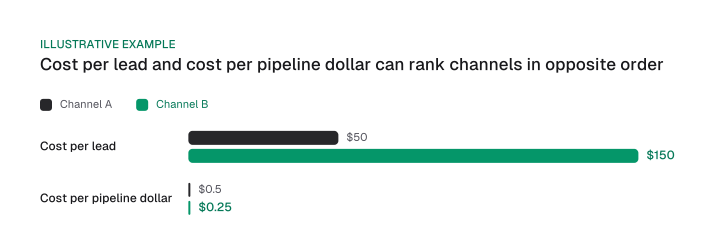
That gap can flip a channel ranking. Take two illustrative channels, not a real campaign:
| Channel (illustrative) | Leads | Cost per lead | Spend | Pipeline generated | Cost per pipeline dollar |
|---|---|---|---|---|---|
| A | 100 | $50 | $5,000 | $10,000 | $0.50 |
| B | 50 | $150 | $7,500 | $30,000 | $0.25 |
Rank these by cost per lead and Channel A wins at $50 against Channel B's $150. Rank the same two by the pipeline-dollar figure and the order flips.
Channel A's $5,000 spend over $10,000 works out to $0.50; Channel B's $7,500 over $30,000 comes to $0.25. Channel B looks worse on the first metric and better on the second, because cost-per-lead never asked what happened to the lead afterward.
Win rate belongs on this tier too, in its marketing-relevant slice: not the full sales-cycle number a sales-ops dashboard tracks, but the close rate on marketing-sourced opportunities specifically. A channel that generates cheap leads that never close is a pipeline-tier problem wearing a revenue-tier disguise, and this narrower number catches it before the CAC math does.
Revenue-tier KPIs: marketing-sourced vs. marketing-influenced revenue, CAC and CAC payback
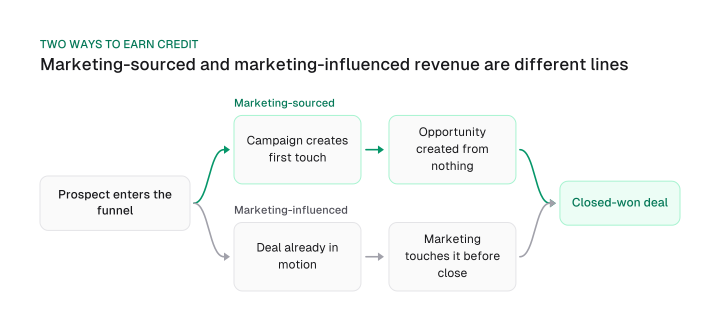
Marketing-sourced revenue and marketing-influenced revenue answer different questions. Report them as two separate lines, always.
Marketing-sourced asks whether the campaign created the opportunity from nothing. Marketing-influenced asks whether it only touched a deal already in motion before close. Averaging the two into one number erases the distinction a board actually needs.
Most B2B deals involve more than one touch before close, which is why that distinction matters. One source, pipeline.zoominfo.com, states twice in the same document that a single deal can span 8 to 12 touchpoints across 6 to 18 months, without citing a study either time.
Take that figure as a directional sense of how spread out B2B influence gets rather than a benchmark to hit.
It explains why a single-touch pipeline-contribution number can misread what actually happened. Multi-touch attribution models exist to spread credit across those touches; which model to trust for your funnel is its own methodology question.
CAC payback period is the formula that turns cost into a timeline: CAC divided by gross margin per customer per month, giving the number of months to repay what you spent acquiring the customer.
One widely read guide, datalane.com, states a repayment window under 12 months is strong, 12 to 18 months is acceptable for high-LTV customer profiles, and anything past 18 months needs an explanation, with no study named behind those bands.
That framing skips the one variable that decides whether the window is healthy: your own gross margin and cash runway. Eighteen months is fine for a company with two years of runway and brutal for one with six months left, and no borrowed band knows which company you are. Run your own numbers through our LTV:CAC calculator before you accept anyone's threshold.
The same guide sets a target of 30%+ of closed-won revenue as marketing-influenced for B2B SaaS, again with no study named, while noting in the same breath that the figure swings widely by go-to-market motion.
Treat that swing as the actual finding: a sales-led motion with long cycles and heavy touch will show a different influenced-revenue share than a product-led motion, and neither is wrong. If you're building the ROI case for a specific channel alongside these KPIs, our ROI calculator runs the same spend-to-return math on your own figures instead of a borrowed target.
MQL, SQL and PQL: making the conversion rate mean something
An MQL-to-SQL conversion rate is comparable across teams only once both sides agree on the exact point where the lifecycle-stage property changes value, the same operational-definition problem from the first section. Two widely read guides publish conflicting benchmarks for that rate, and neither discloses its own definition or names the other's number:
datalane.com states MQL-to-SQL conversion of 25%+ is a workable benchmark for most B2B teams.
contra.agency attributes to "SalesForce" a healthy MQL-to-SQL range of 30 to 50 percent, though no locatable Salesforce publication states that range.
There's no way to reconcile 25%+ against 30-50% from the outside. Nothing in either page says whose SQL bar is stricter, which is precisely why the gap exists.
Chasing either borrowed percentage is the wrong move. Write down your own team's shared definition of what makes an SQL an SQL first, then run your own conversion figure against that definition for a few quarters before deciding if it needs fixing.
Product qualified leads (PQLs) sit as a third lead-qualification tier alongside MQL and SQL, used by product-led companies where usage data, not a form fill, signals sales readiness. That's a scoring model with enough depth to earn its own guide; here it's enough to know PQL exists as an option when your product generates usable activation data before a sales conversation starts.
How many KPIs to track, and why one north star isn't enough in B2B
There's no fixed KPI count here: it's the head-metric-plus-guardrail rule, applied once per funnel tier.
Our own guide to SEO KPIs already lays out the base version: one north-star metric plus two or three supporting KPIs, sized to the objective, never a number copied from someone else's list.
That rule holds for a single-tier dashboard. A B2B funnel doesn't stay single-tier: its activity, pipeline and revenue tiers can move independently of each other for months at a stretch, which is exactly what the second section showed.
A single north-star metric picked at one tier can't also serve as the early warning for a problem building in a different tier. So the fix applies the head-metric-plus-supporting-metrics rule once per funnel tier, instead of once across the whole dashboard.
That gives six lines:
| Tier | Head metric | Guardrail metric | Owner |
|---|---|---|---|
| Activity | MQL volume | Content engagement rate | Demand generation |
| Pipeline | Pipeline contribution % | Cost per pipeline dollar | Marketing ops |
| Revenue | CAC payback period | Marketing-influenced revenue % | VP Marketing |
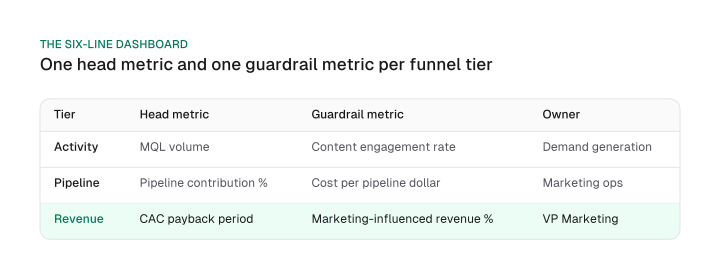
Six is the shape this reasoning arrives at for a typical B2B funnel. Swap in the metrics that fit yours, as long as each tier keeps its pair.
This same per-tier logic is one step inside the broader growth-marketing process of choosing a north-star metric and prioritizing experiments around it. It sits below any single company-wide north-star metric, at a different altitude entirely.
Every line past six competes for the same slide without covering a tier nobody is watching yet. Every line short of six leaves a tier with no early warning at all.
A dashboard needs a head metric and a guardrail metric at every funnel tier, because the tiers move on their own schedules. A single number, however well chosen, can only watch one of them.
Pull up your current dashboard and count the lines against those three tiers. If a tier has no guardrail, or six lines have become sixteen, that's the edit to make before your next board meeting.
Frequently asked questions
What is the rule of 7 in B2B?
No locatable peer-reviewed or otherwise verifiable source ties the number seven specifically to B2B buying behavior. Treat it as a mnemonic, not a threshold, and track the pipeline-tier and revenue-tier KPIs from this guide instead of counting touches toward seven.
What's a good marketing-influenced revenue percentage?
One unsourced guide puts 30%+ of closed-won revenue at a reasonable target for B2B SaaS, but the figure varies by go-to-market motion. Report marketing-sourced and marketing-influenced revenue as two separate lines and judge each against your own trend, rather than a single borrowed target.
What are the 5 key performance indicators in marketing?
There's no fixed five. Apply the head-metric-plus-guardrail-per-tier rule from this guide to your own funnel: three tiers, two metrics each, six lines, adjusted to what your funnel actually needs.
What's the difference between a marketing KPI and a marketing metric?
A metric becomes a KPI once it carries a named objective, an accountable owner, a threshold and, in B2B specifically, an operational definition precise enough for two teams to compute the same number from the same event.
How is a B2B marketing KPI different from a B2C one?
A B2C KPI usually tracks one action by one person on one channel. A B2B KPI tracks a state change on a shared account-level record, over a longer cycle, which is why the operational-definition condition matters more here than in B2C reporting.
Figures and images in this post are free to reuse under CC BY 4.0 with credit to Mission Growth.
Get Mission Growth highlighted in your Google results.