SEO KPIs Guide: What to Track and How to Read the Data
The SEO KPIs worth tracking in 2026, the exact formulas and Google-sourced thresholds behind them, and a decision rule for how many to watch and when to worry.

On this page
Every top-ranking guide for "SEO KPIs" hands over the same list, ten to twenty metrics, several backed by a benchmark table that contradicts the next page's version of the same table. Search a "CTR by position" benchmark across the current top ten and the ranges pull in noticeably different directions depending which page you land on.
No source backs any of those ranges. A metric definition padded with an unsourced range is the reason most of these lists read the same and none of them helps a reader decide anything.
This guide is about deciding SEO KPIs to track, rather than repeating every metric available. It replaces the borrowed benchmarks with the actual mechanism behind the two KPIs readers misread most, click-through rate and zero-click share.
It adds a formula for computing your own baseline instead of comparing it to a stranger's number, and a decision rule for how many KPIs to track and which ones to drop. It sits inside Mission Growth's wider generative engine optimization coverage, where measurement is one part of a broader SEO and GEO practice.
What is an SEO KPI, and how is it different from a metric?
An SEO KPI is a metric that meets three conditions at once:
- Tied to a specific business goal.
- Has a named owner accountable for moving it.
- Carries a threshold that defines whether the current number is healthy.
Drop any one of the three and it stays a metric rather than a KPI, even if someone reports it every week.
The plain answer to "what is KPI in SEO" is exactly that combination: a goal, an owner, and a threshold, held together. Any single one alone isn't enough.
The KPIs vs metrics distinction comes down to those same three conditions. A metric with a goal but no owner and no threshold is still a metric, no matter how often someone reports it.
Google's own approach to setting objectives backs two of those three conditions directly. Its re:Work guide to OKRs requires every key result to tie back to an objective and to be gradable with a number, which covers the goal and the threshold.
The owner condition is not something that guide states; it is the practical addition that turns a graded number into something a team actually acts on, because a threshold nobody owns just sits quietly in a report until someone asks about it.
Most teams inherit their KPI list from whatever the last SEO audit happened to flag, then never re-test each line against these three conditions. Organic sessions, impressions, and average position get treated as KPIs by default.
In most reports those three sit as metrics with no named owner and no stated threshold attached to them. A number becomes a KPI only when all three conditions hold together; most "SEO KPI" lists are really metric lists, because they skip the owner and the threshold and keep only the goal.
Visibility KPIs: traffic, impressions, rankings and the branded split
Visibility KPIs, organic traffic, impressions, keyword rankings, and the branded split, tell you whether more of the right people can find you, not whether they act once they do.
Each one answers a narrower question than it looks like it does. The table below gives SEO KPI examples across visibility, alongside where to pull each number and what it leaves out.
| KPI | What it measures | Where to find it | What it does NOT tell you |
|---|---|---|---|
| Organic traffic / sessions | Visits arriving through unpaid search | GA4, Traffic acquisition report, Organic Search channel | Whether those sessions convert or stay |
| Organic impressions | How often your pages appeared in search results | Google Search Console, Performance report | Whether the searcher noticed the result or clicked |
| Keyword rankings | Where a URL sits for a given query | Google Search Console, rank trackers | Whether the ranking is stable, or split across your own URLs |
| Branded vs. non-branded traffic | Search volume on your own brand terms vs. everything else | GSC query filter, split manually | A "healthy" ratio; none is published |
| Backlinks | Referring domains and links pointing at your site | GSC Links report, backlink tools | Link quality, relevance, or where the links come from |
Download CSV (CC BY 4.0)
The branded-versus-non-branded split is worth watching as a trend; chasing it as a target level misses the point. No verified public source backs a "healthy" percentage for that split at this granularity, and any single figure would depend heavily on brand size and category anyway.
What matters is the direction it is moving. Non-branded share growing means new audiences are finding you through the query itself, beyond people who already knew your name. A shrinking share is worth investigating even without a benchmark to compare it against.
Brand mentions, unlinked references to your company across the web, belong in this group too, as a softer, upstream signal. They tend to precede branded search growth rather than substitute for it. The separate question is whether AI answer engines cite your content directly, beyond simply mentioning your brand somewhere in ordinary web text; AI search visibility metrics covers that measurement on its own terms.
Click-through rate: the KPI everyone mismeasures
Comparing your click-through rate to a borrowed "industry average" table is close to meaningless, because CTR feeds directly into how Google reorders results after they have already been ranked.
It also behaves differently by position, niche, and sample size than any single table can show.
That reordering is not SEO folklore. A Google patent, "Modifying Search Result Ranking Based on Implicit User Feedback," describes comparing each result's long clicks against its short clicks, applied per document and independent of the other results on the page, specifically to reduce distortion from position or snippet wording.
A leaked set of Google's own Search API documents later named the click-signal fields behind a related system, goodClicks, badClicks, lastLongestClicks, tied to something called NavBoost.
Google ranking factors covers that mechanism in full, down to the same patent and the same caveat that a patent describes a mechanism without proving the shipped system still runs on it unchanged. It is linked here rather than repeated, because CTR's role in that system is exactly why a flat benchmark table cannot stand in for your own number.
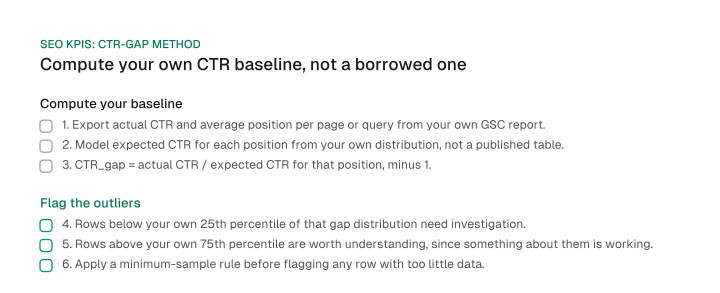
Build your own baseline instead of reaching for someone else's table:
| Step | What to do |
|---|---|
| 1. Pull the data | Export actual CTR and average position per page or query from your own GSC report. |
| 2. Set your expected CTR | Model expected CTR for each position from your own distribution, not a published table. |
| 3. Compute the gap | CTR_gap = actual CTR / expected CTR for that position, minus 1. |
| 4. Flag the outliers | Set your own minimum-impression floor first, so a handful of impressions can't swing the gap; then flag rows below your own 25th percentile of that gap distribution for investigation and rows above your own 75th percentile as worth understanding, since something about them is working. |
Zero-click and AI Overview impact on CTR
Zero-click search shows the same borrowed-number problem. SparkToro's modeled estimate puts the share of US Google searches ending without a click at roughly 68% for the period running January through April 2026, computed from Similarweb's raw panel data using SparkToro's own stated assumptions about device split, session cutoff, and paid-click ratio, a modeled estimate rather than a direct measurement of every search.
That reading runs meaningfully higher than the roughly 60% figure some pages still cite for 2024. SparkToro's own write-up calls comparing the two numbers "apples and oranges," since the earlier figure came from a different data panel entirely.
A zero-click result is not automatically a loss, either. Google's own "good abandonment" research, by Li, Huffman and Tokuda at the ACM SIGIR conference, studied searches where the searcher's need was fully met on the results page with no click required.
The study found a real share of zero-click sessions resolve exactly this way, with mobile search showing a higher good-abandonment rate than desktop search across every locale it tested.
Falling clicks paired with flat or rising impressions can mean the SERP answered the query well enough that no click was needed, rather than signaling your page lost visibility.
None of this is the same question as whether an AI engine is citing your content directly and sending AI referral traffic, a separate measurement problem from the click mechanics covered here.
Mission Growth's platform tracks AI citations and visibility for customers.
AI-answer visibility is where that side of measurement gets its own full treatment.
Engagement and quality KPIs: engagement rate, bounce rate, average engagement time
Engagement rate and bounce rate are the same measurement stated two different ways.
GA4 counts a session as "engaged" when it lasts more than 10 seconds, includes a key event, or reaches 2 or more page or screen views. Bounce rate is simply the percentage of sessions that meet none of those conditions, the mathematical complement of the engagement number.
Tracking both side by side is redundant, even though plenty of reports list them as if they were independent. State one and the other is already known: bounce rate is simply the numerical complement of engagement rate, not a separate calculation that earns its own line in a report.
Pick one. Engagement rate reads more naturally as a "higher is better" number for a stakeholder skimming a dashboard, so it is the one worth keeping.
Average engagement time, the third metric in this group, earns its own line alongside it, since it measures something engagement rate does not: how long the engaged sessions actually last, beyond whether they simply cleared the threshold that counts a session as engaged at all.
Drop the redundant half of this pair from your SEO report template and you free up a line for a KPI that is not derivable from another one already on the same page.
Business-impact KPIs: conversion rate, ROI, CPA, and CLV
Conversion rate, ROI, CPA, and CLV turn traffic into a number a budget decision can actually be made on.
Only CPA and CLV keep working once SEO's exact contribution to revenue can't be cleanly attributed yet.
The standard formulas, restated plainly:
- Conversion rate = conversions / sessions. It's the fastest of the four to compute and the easiest to misread on its own, since it says nothing about the value of what converted; pair it with CLV before reporting it as a win.
- ROI = (revenue attributed to SEO minus cost of the SEO program) / cost of the SEO program.
- CPA = SEO program cost / number of conversions.
- CLV = average order value × purchase frequency × customer lifespan.
ROI is the formula most teams get stuck on, because "revenue attributed to SEO" assumes an attribution model that is already built and already trusted, and plenty of teams do not have one yet. When you cannot attribute revenue to SEO directly, do not wait for perfect attribution before setting a KPI. Use an interim proxy chain instead.
Take a hypothetical SaaS company running SEO and paid search side by side. Organic produces a count of assisted conversions each month, pulled from the analytics platform's assisted-conversion path report, a proxy signal rather than a first-touch or last-touch revenue claim.
Paid search already runs its own blended customer acquisition cost, a number the team trusts because it comes straight from ad spend divided by paid conversions. Compare organic's assisted-conversion count and its own rough cost per assisted conversion against that paid CAC as a directional check.
Set a lead-volume threshold, a minimum monthly count of assisted conversions, as the interim KPI standing in for ROI. Once organic assisted conversions clears that threshold, and its rough cost per conversion sits under the paid CAC anchor, treat that as the signal SEO is pulling its weight, even before a full attribution model exists to prove it with a dollar figure.
CPA and CLV do not carry this problem, since both run off cost and customer data the team already owns; run your own program's numbers through Mission Growth's ROI calculator and LTV:CAC calculator rather than building the spreadsheet from scratch.
Technical health KPIs: Core Web Vitals and crawl errors
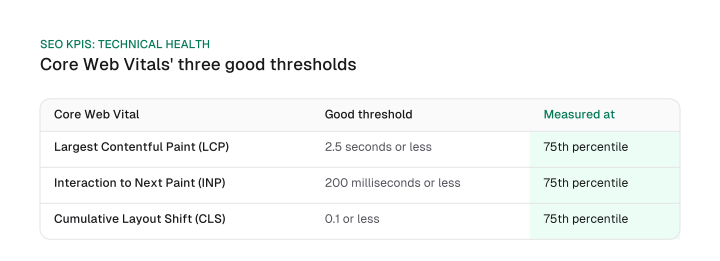
Core Web Vitals are the one part of "page experience" Google confirms as a direct ranking input, with three named thresholds.
Largest Contentful Paint at 2.5 seconds, Interaction to Next Paint at 200 milliseconds, and Cumulative Layout Shift at 0.1, each measured at the 75th percentile of real user data rather than an average.
There is no single blended "page experience score" behind these numbers, whatever a dashboard vendor's summary tile implies. Google evaluates Core Web Vitals, HTTPS, mobile-friendliness, and intrusive interstitials as separate signals, and Core Web Vitals is the only one of the four confirmed to move rankings directly.
Crawl errors and indexing health round out this group, not as a KPI with a target number of its own, but as the diagnostic layer that explains a Core Web Vitals dip or a traffic drop before it shows up anywhere else.
A spike in GSC's coverage report, pages moving from indexed to excluded, is usually the first signal a technical issue is underway, ahead of any visible traffic change. The technical SEO audit process is where that gets diagnosed in full; this page's job is knowing it is worth checking first.
SEO KPIs to deprioritize: rankings and other vanity-adjacent numbers
Average keyword position, tracked and reported as a single number, is the weakest KPI on this list.
Google Search Console's own Position metric reports only the topmost of your own competing URLs per query, averaged across queries, which isn't a true average across your whole site. Run two pages for the same query, deliberately or by accident, and GSC quietly reports whichever one ranks higher, masking the cannibalization that is actually costing you traffic.
That is a reason to demote raw rank position from KPI to diagnostic signal, though it's still worth watching. It earns a look for spotting cannibalization, two of your own URLs trading rank for the same query, and for spotting volatility around an algorithm update.
It is just the wrong number to put in front of a stakeholder as "we're #3 now," since a #3 average can hide two URLs splitting a query that a single, consolidated page would rank higher for on its own.
Two more numbers belong on this same list of SEO KPIs to ignore as standalone targets, even while you keep watching them as diagnostics:
- Backlinks. Referring-domain counts move slowly and say nothing about link quality or relevance on their own; useful as a trend, weak as a standalone KPI.
- Brand mentions. A leading indicator for branded search growth, not a substitute for it; track the trend, do not set a target on it.
How many KPIs to track, and how to pick your north star
Most teams should report one north-star KPI tied directly to the business objective, plus 2 or 3 supporting KPIs that explain what is driving it.
That answers how many SEO KPIs should you track, in practice: a short, fixed list rather than a growing one. Everything past that point is noise competing for the same slide.
| Dimension | North-star KPI | Supporting KPIs |
|---|---|---|
| Audience | Leadership, clients | The team doing the work |
| Cadence | Quarterly, with a mid-quarter check-in | As often as the team already meets |
| Example | Qualified organic conversions | CTR gap, impressions, engagement rate |
| Changes | Rarely, only when the business objective changes | Freely, as the diagnosis needs |
Download CSV (CC BY 4.0)
Match the reporting cadence to who is actually reading the number. Google's own OKR guide grades objectives on a quarterly cycle with a mid-quarter check-in, not weekly, because a north-star number needs time to move meaningfully.
The team running the day-to-day work needs faster-moving supporting signals instead, reviewed at whatever cadence the team already runs, a two-week sprint if that is the working rhythm already in place.
Conflating the two, changing the north-star number every time a supporting metric wobbles, is why "how often should we change our KPIs" keeps coming up as a question.
There is no fixed five main KPIs and no fixed top three; apply this north-star-plus-supporting cut to your own objective instead of copying someone else's list. Build the dashboard those numbers live in on the SEO dashboard build guide, and set the reporting rhythm itself on the SEO reporting cadence page.
What to check first when a KPI drops
Google names six causes for a search traffic drop: an algorithmic update, a technical issue, a security issue, a spam policy violation, a seasonal or interest shift, or a site migration.
Each one leaves a different signature across your KPIs, before you have diagnosed anything by hand.
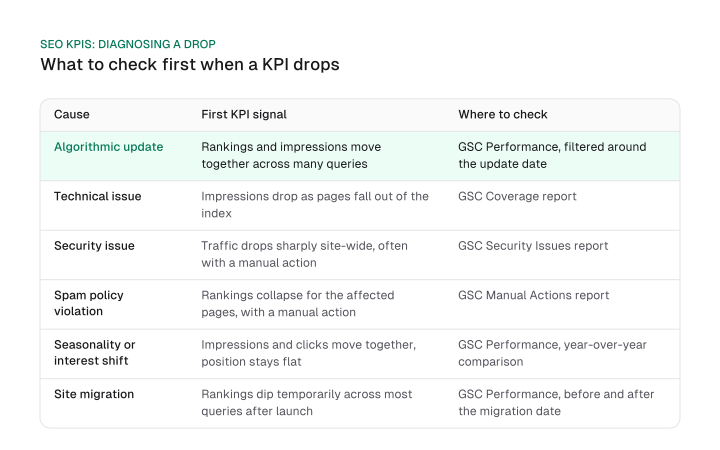
Read impressions, CTR, and average position together before concluding "the algorithm changed," since that is the default explanation and the one the matrix above argues against reaching for first.
A drop in clicks paired with flat impressions and flat position points at a CTR or SERP-feature cause, an AI Overview or a new featured snippet eating the click without touching your ranking at all. A drop in impressions, by contrast, points at indexing trouble or a real ranking loss, worth confirming in GSC's coverage report before blaming an algorithm update for something a crawl error caused.
The other four causes leave their own signature, and GSC names the report that surfaces each one. An algorithmic update reads as rankings and impressions moving together across many queries, checked in GSC Performance filtered around the update date; a technical issue reads as impressions dropping as pages fall out of the index, checked in GSC's coverage report.
A security issue or a spam policy violation drops traffic sharply, or collapses rankings on the affected pages, alongside a manual action GSC's security issues and manual actions reports both surface directly, something an algorithmic move rarely comes with.
A seasonal or interest shift moves impressions and clicks together while position stays flat, visible year-over-year in GSC Performance. A site migration shows up as a temporary rankings dip spread across most queries right after launch, visible by comparing GSC Performance before and after the migration date.
Every ranking guide for this query hands over the same flat KPI list, several padded with a benchmark table that contradicts the next page's version of it.
This one replaces those borrowed numbers with the mechanism behind the two KPIs readers misread most, a formula for computing your own baseline instead of comparing it to a stranger's, and a decision rule for how many KPIs to track and which ones to drop.
Start with the number that is easiest to get wrong. Pull your own GSC export, compute your own CTR gap against your own distribution, and pick one north-star KPI for the quarter ahead before adding anything else to the report.
Frequently asked questions
There is no fixed five. Apply the north-star-plus-supporting-metrics rule from the KPI-selection section above to your own business objective: one north-star number, plus 2 or 3 supporting metrics that explain what is driving it.
Same cut-line logic, condensed further for a resource-constrained team: one north-star KPI plus 2 supporting metrics is enough to run a report on, as long as the north star ties to the actual business objective rather than to whatever number is easiest to pull.
A metric becomes a KPI only when it is tied to a specific business goal, has a named owner accountable for moving it, and carries a threshold that defines whether the current number is healthy. Drop any one of the three and it stays a metric rather than a KPI.
Do not wait for a full attribution model before setting a KPI. Use an interim proxy chain instead: compare organic's assisted-conversion volume and its rough cost per conversion against a blended paid CAC, and set a lead-volume threshold as the interim stand-in for a revenue KPI.
Yes, tracked as separate rows under the same visibility KPIs, since they answer different questions. Branded performance is a trust and demand signal; non-branded performance measures reach into audiences who did not already know your name.
The north-star number stays fixed for a quarter, matching Google's own OKR cadence and its mid-quarter check-in. Supporting or tactical KPIs can change as often as the team's own working cadence allows, without touching the north star in the process.
Figures and images in this post are free to reuse under CC BY 4.0 with credit to Mission Growth.
Get Mission Growth highlighted in your Google results.