SEO Dashboard: Build One in Looker Studio the Right Way
Build an SEO dashboard in Looker Studio the right way: connect Search Console and GA4 correctly, blend the data, choose a layout and set real alerts.
On this page
An SEO dashboard is supposed to answer one question: is organic search working right now, without you pulling numbers by hand. Connect Search Console and GA4 to Data Studio (formerly Looker Studio), and the job looks solved.
It isn't. Three mechanical failure points sit between "connected" and "working."
Search Console and GA4 disagree by design. Both cap and cache what the connectors pull. And blending them into one chart breaks the moment a URL format doesn't match.
None of that shows up in a vendor template library, so your dashboard just looks broken. It isn't. It's behaving exactly as documented, and once you know the numbers behind each failure point, you can build around them.
That's the job this page does: a free Looker Studio SEO dashboard with three tabs. It also names the exact row limit, the quota and the cache window at each step.
What an SEO dashboard actually is
An SEO dashboard is a live, self-serve view of organic performance, built from your own Search Console and GA4 connections.
It holds the scorecards, trend charts and tables you check on your own schedule, not a screenshot someone hands you once a month. Skip it and you're back to pulling Search Console and GA4 numbers by hand every week, which is the work a dashboard does for you.
Metric selection and the stakeholder report are separate jobs with their own rules, which is the real SEO dashboard vs SEO report split. This page builds only the live view; SEO reporting covers the stakeholder report.
For example, a solo SEO who just wants to check impressions before a client call needs only that live view, not a KPI framework or a slide deck.
If you manage reports resold under an agency's own brand across dozens of client accounts, that's a paid vendor feature; it sits outside a single-account build like this one. Turning that data into a revenue case or a fix-priority list for stakeholders is a different job again, one this page doesn't cover.
Why your Search Console and GA4 numbers won't match
Search Console and GA4 disagree by design. They define timezone, URL scope, bot traffic and attribution differently, and no setting reconciles that.
Five defaults drive most of the mismatch:
- Timezone. Search Console defaults to Pacific Time; GA4's timezone is set per property.
- URL scope. Search Console counts only the canonical URL Google picked; GA4 counts every tagged URL.
- Bot traffic. GA4 automatically excludes known bots and spiders; Search Console doesn't necessarily filter them out.
- Counting model. Search Console counts every click; GA4 applies an attribution model to sessions instead.
- Reporting delay. Search Console data can lag the current day by a couple of days.
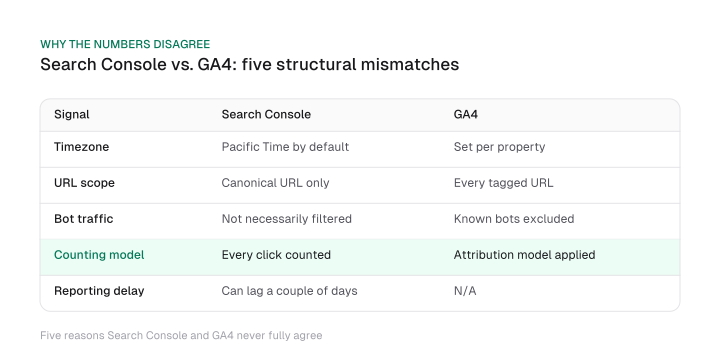
Google documents the mechanics behind why Search Console and GA4 report different numbers, and all five causes trace back to that one page.
None of them is a setting you can fix. So show both sources side by side on the dashboard, instead of building a chart that forces them to match.
Connect Search Console and GA4 without hitting the ceiling
Search Console and GA4 both cap and cache what Data Studio can pull in a single connection. Hit either ceiling, and the dashboard looks exactly like a broken one.
The Google Search Console dashboard tab runs on the Search Analytics API. The Search Console website's own Performance report also caps out, truncating exports to 1,000 rows per Google's help documentation checked in September 2026, and the Search Analytics API behind Data Studio adds its own per-request limit on top.
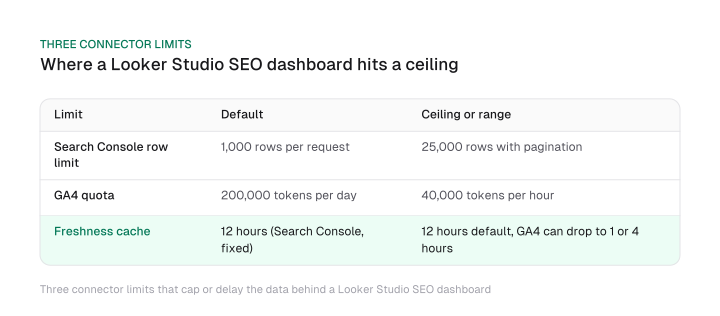
Three limits catch almost every build:
- The Search Console row limit. Defaults to 1,000 rows per request, up to 25,000 with pagination.
- The GA4 quota. A GA4 SEO dashboard tab caps out at 200,000 tokens a day and 40,000 an hour on a standard property; queries touching roughly 10 million events can start sampling.
- The freshness cache. Search Console refreshes every 12 hours; the Analytics connector defaults to 12 hours too, but can drop to 1 or 4.
For example, a site with 40,000 queries in your date range shows only the first slice of that data. Someone has to paginate the connector with startRow, or the report needs a BigQuery export instead.
Analytics 360 properties get a much larger token allowance. But this build assumes a standard property, which is what most readers have, and most single-site builds never get close to that ceiling in a normal day.
And none of this is real time, whatever a vendor template calls it. If a number looks stale, shorten the Analytics connector's refresh window or refresh the report manually.
Three fixes handle all of it:
- Paginate past the default. Set
startRowand loop the request yourself. - Export to BigQuery for large sites. Both connectors export to BigQuery, which skips the API ceilings entirely. Sites that size usually bring their own crawl and sign-off limits too, covered in enterprise SEO.
- Shorten the refresh window. Set Analytics to 1 or 4 hours if your team checks the dashboard daily.
Blend Search Console and GA4 into one view
Blending Search Console and GA4 in Data Studio works only when both sources share a matching dimension, a join key, such as landing page URL.
A join key is the set of matching fields Data Studio uses to line up rows from two sources. Search Console's "page" field and GA4's "landing page + query string" field look similar. But they're formatted differently by default, and Data Studio blends only on exact matches.
For example, Search Console might store a page as /guide while GA4 stores it as /guide/. Add a mismatch between http and https on top, and the blend quietly drops rows or counts some of them twice. Neither error throws a warning.
Here's the fix:
- Normalize both URL fields first. Strip the protocol and any trailing slash on each side before you blend.
- Join on the cleaned field. Build a calculated field that strips both differences, then match on it instead of the raw fields.
- Add a third source the same way. Semrush, Ahrefs, Moz and SE Ranking data all blend on the same normalized URL.
Add sources one at a time. That way, if a chart stops populating, you know exactly which join broke it.
Build the dashboard: three tabs, one blueprint
A vendor-neutral SEO dashboard needs three tabs built only on native connectors, so it doesn't break the day you cancel a paid tool.
This SEO dashboard template skips the pre-built vendor libraries entirely. Here's what goes in each tab:
- Overview. Scorecards for clicks, impressions and average position, plus one trend chart.
- Queries and pages. A sortable table of top queries and landing pages, blended with GA4.
- Technical health. Indexation, Core Web Vitals and crawl errors, fed by the technical SEO checks you're already running.
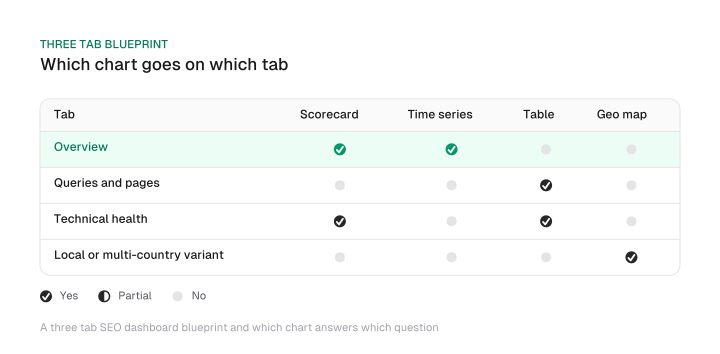
Match each chart to the question it answers, not to what looks impressive on the page. A scorecard for "clicks this month" tells you nothing about direction, so pair it with the chart that does:
- Scorecard. States one current number, nothing more.
- Time series. Shows a trend across your date range.
- Table. Holds query- or page-level detail a single number can't carry.
- Geo map. Earns its place only for a site covering several countries, or a local SEO build.
An ecommerce, local or agency variant of this dashboard doesn't need a fourth tab. It just swaps the queries, the dimensions and the filters that populate the same three tabs.
An ecommerce build filters to transactional queries. A local build adds a location dimension. An agency build duplicates the same three tabs once per client.
Set alerts that actually work
Data Studio's native chart alerts are a Data Studio Pro feature, so a free SEO dashboard needs a workaround to flag problems on its own.
That's a real gate. Threshold alerts ship only in the paid tier, and the free product has no built-in trigger to replace them. Two workarounds get you close:
- A conditional formatting scorecard. Changes color once a metric crosses a threshold you pick.
- A scheduled email digest. Emails the report on a fixed cadence instead of on a real trigger.
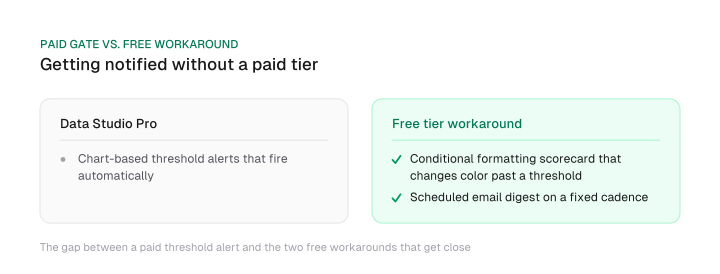
Neither one fires the instant something breaks. But a red tile or a Monday-morning email beats checking a dashboard nobody remembers to open.
Sharing follows the same free-tier logic. Give stakeholders viewer access through a link, and keep editor access for whoever maintains the connectors and blends, usually one person. One broken join key can quietly take down every chart on the page, so you want few hands near it.
What this dashboard won't show you
A Search Console and GA4 dashboard only measures classic organic search: it can show an AI referral click, but not a citation that never produced one.
GA4 picks up a referral click from a ChatGPT or Perplexity answer the same way it logs any other referral. But there's a hard line between what shows up and what doesn't:
- Visible to GA4: a referral click from inside an AI assistant's answer.
- Invisible to both tools: a citation or mention that never produced a click.
That's a structural scope edge. Search Console indexes and reports on Google Search, and GA4 measures sessions that reach your site, so a mention with zero click-through stays invisible to both.
If you need AI search analytics alongside classic organic tracking, that's a different measurement problem: citations and AI referral traffic instead of clicks and rankings.
GEO vs SEO covers why the two disciplines need separate measurement. Tracking ChatGPT mentions of your brand walks through the GA4-side workaround for the referral clicks this dashboard can catch.
Mission Growth's platform tracks AI citations and visibility for customers. That's the specific piece a Search Console and GA4 build structurally can't cover.
The three failure points that break most DIY builds, source disagreement, connector ceilings and a mismatched join key, are mechanical. You now have the exact numbers behind each one.
Here's where to start:
- Connect first. Open Data Studio and connect Search Console and GA4 before anything else.
- Build the overview tab first. It's the one tab that proves the connections actually work.
- Add the other two tabs next. Queries and pages, then technical health, once the overview checks out.
Frequently asked questions
Search Console and GA4 disagree mainly because of two defaults: Search Console reports in Pacific Time while GA4 uses your property's own timezone, and Search Console counts only the canonical URL Google picked while GA4 counts every URL carrying your tracking tag. Both gaps are structural, so build the dashboard to show both sources rather than reconciling them.
The real ceiling isn't a vendor plan, it's the connector. The Search Console connector's API defaults to 1,000 rows per request, up to 25,000 with pagination, and GA4's standard-property API caps out at 200,000 tokens a day and 40,000 an hour. A large site needs pagination or a BigQuery export to see everything.
No. Chart-based threshold alerts ship only in Data Studio Pro. The closest free equivalent is a conditional formatting scorecard that changes color past a threshold, or a scheduled email digest, and neither one fires the instant something breaks.
Only past the free build's real ceilings: a very large site that needs a BigQuery export to avoid row limits, an agency managing reports under its own brand across many client accounts, or native threshold alerting. Those are paid vendor features, not Looker Studio build steps, and they're the honest reason to buy a dashboard tool instead.
Not fully. GA4 can log a referral click from an AI assistant's answer the same way it logs any other referral, but neither Search Console nor GA4 can show a citation that never produced a click. That's a separate measurement problem, covered by AI search analytics rather than classic organic tracking.
Figures and images in this post are free to reuse under CC BY 4.0 with credit to Mission Growth.
Get Mission Growth highlighted in your Google results.