SEO Reporting Guide: How to Create a Report (+ 2 Templates)
SEO reporting made practical: how to create a report stakeholders read, 2 free templates (weekly and monthly), what to include and how often to send it.

On this page
SEO reporting earns its place on someone's calendar only when it's built for the person reading it. A 2025 survey of 220+ agency leaders found that 70% call client reporting "extremely important" for retention: the report itself is part of the product.
Most teams send one version to everyone anyway. A weekly check, a monthly client update and a quarterly leadership review often get built from the same template, run on a different clock. That's backwards.
Cadence and audience decide the report's structure before a single metric gets pulled. Treating that as one decision instead of two is what this guide walks through.
Here's how to create an SEO report your audience actually reads:
- A matrix crossing cadence and audience that shows what each report version is actually for
- Two templates you can copy directly: a 5-section weekly check and a 7-section monthly report
- A repeatable table for turning a raw metric into a sentence a stakeholder can act on
- Where AI search visibility belongs in the report, with Google's own 2026 measurement features
- A structure for reporting a bad month without losing trust
- A rule for when to automate that isn't tied to one tool
What an SEO report is, and who actually reads it
An SEO report is a scheduled account of organic-search performance built for one reader's decision. The same version rarely serves an executive, a client and a technical team equally well.
Ask what is an SEO report at a client kickoff and you'll get three different answers: a PDF, a live dashboard, a slide deck. A report differs from a dashboard: a dashboard updates continuously and lets the reader explore, while a report is dated and built to answer one question.
Three cadences cover almost every use case, and each one has a different job:
- Weekly. Goes to the technical or internal team, for campaign launches, migrations or incident response, where a ranking or traffic drop needs an answer within the week.
- Monthly. Goes to a client or marketing stakeholder. It's the default cadence for ongoing retainer performance tracking, the version most reporting relationships run on.
- Quarterly. Goes to leadership or executives, to support budget and strategic-direction decisions, trading weekly detail for a longer trend line.
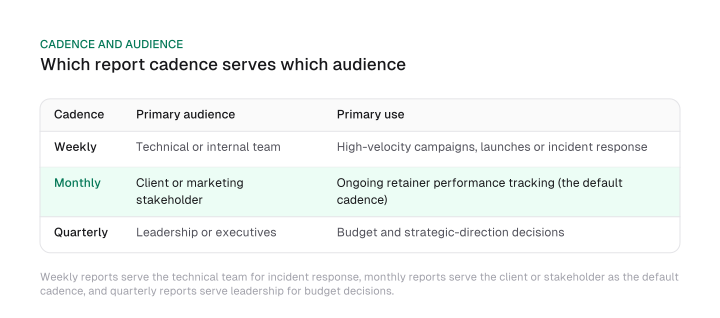
Read the matrix as one decision instead of two separate settings. A monthly cadence built for a leadership audience buries the executive in campaign detail; a weekly cadence built for a client reads as micromanagement. Pick cadence and audience together, and the rest of the template follows from that choice.
The SEO report template: what belongs in every version
The SEO report template has a fixed core of sections.
A weekly internal check and a monthly stakeholder report use that same core at a different depth. Here are two structures you can copy directly.
The weekly internal check (5 sections):
- Ranking movement: biggest gainers and losers for the week, by keyword group.
- Organic traffic snapshot: sessions and top landing pages against the prior week.
- Technical health score: crawl errors, indexation issues and Core Web Vitals status; a technical SEO checklist gives you the full audit this score is pulled from.
- Open action items: what's assigned, to whom, and due when.
- Blockers for next week: what needs a decision or resource before it can ship.
The monthly stakeholder report (7 sections):
- Executive summary: three lines, what worked, what didn't, what's next.
- Traffic and conversions against goal, framed as what the movement means for SEO ROI rather than raw session counts.
- Keyword ranking movement, grouped by priority tier.
- Backlink profile change: net new links and any losses worth flagging.
- Technical health score, summarized in one line from the weekly detail.
- Competitor benchmark snapshot: one line on how your visibility moved relative to the field, no full methodology attached.
- Next month's priorities, tied to the goal in section 2.
Which specific metrics matter most for your report is a separate decision that depends on your business model and stage. This template only names the categories that fill each line item: organic traffic, keyword rankings, conversions, technical health, backlinks, competitor overview.
Turning metrics into a narrative stakeholders act on
A metric earns a place in the report only after it's rewritten as what changed, why it changed and what happens next.
Stakeholders don't act on a raw percentage. They act on what caused it and what you're doing about it.
Executives want the outcome version of that sentence. A technical team wants the same movement stated with the underlying cause attached, and the reframe below works for either, you just adjust how much mechanism you include.
| Metric movement | Plain-language reframe | Likely driver | Recommended action |
|---|---|---|---|
| Organic traffic down | "Fewer visitors found us through search this period" | Seasonal demand, a lost ranking, or a technical block | Check the ranking and technical sections before concluding demand fell |
| Rankings dropped for a priority term | "We lost visibility on a term that drives revenue" | A competitor update, an algorithm change, or a content gap | Compare the current top-ranking page against yours for what changed |
| Conversions flat despite traffic growth | "More visitors, same number of customers" | Traffic quality shifted, or the landing page isn't converting | Segment traffic by source before touching the page itself |
| Technical score dropped | "The site got harder for search engines to crawl or read" | A recent deploy, a broken redirect, or new crawl errors | Fix the highest-impact error first, then re-check the score next period |
| Backlinks declined | "Fewer sites are pointing to us than last period" | Expired partnerships, a removed guest post, or a disavow | Confirm whether the loss is from low-value or high-value domains |
Download CSV (CC BY 4.0)
For example, a technical score that drops right after a deploy points straight at a broken redirect; check that before you touch a line of content.
The table generalizes; the sentence in front of the reader shouldn't. Say which metric moved, by how much, and which row explains it, so the reader gets a specific answer instead of a category.
Where AI search visibility fits in the report
AI search visibility belongs in the SEO report as its own line, because Google now ships two native features built to measure it.
Putting AI visibility in SEO reports means giving each feature its own line: Search Console's Generative AI performance report, and GA4's AI Assistant channel.
Here's what each one actually measures:
- Search Console's Generative AI performance report. Impressions only, for AI Overviews and AI Mode, broken out by page, country, device and date; Discover keeps its own separate report. Google finished the worldwide rollout on August 31, 2026.
- GA4's AI Assistant channel. Groups referral visits from AI assistants such as ChatGPT and Gemini into their own default channel, added to the platform on May 13, 2026.
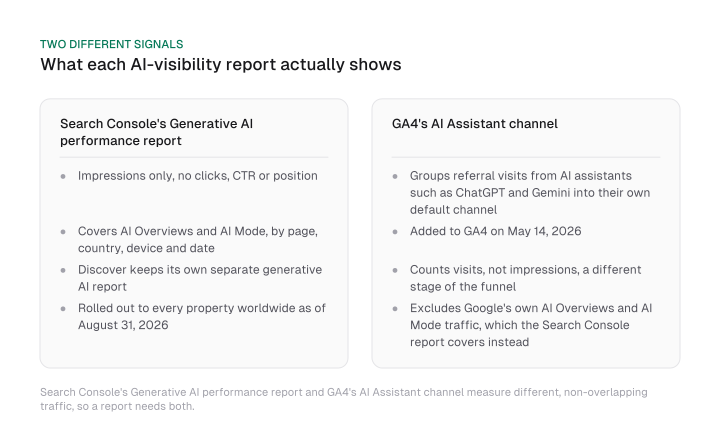
A report built on just one of these tells half the story. The Search Console report counts exposure in Google's AI answers, but it can't confirm anyone clicked through.
GA4's channel counts visits that did convert into a session, only from assistants that pass a referrer. It excludes Google's own AI Overviews and AI Mode traffic, which the Search Console report already covers.
Read the two lines together: Search Console's impressions and GA4's AI Assistant visits cover two slices of AI search traffic that don't overlap. Either one alone misses half the picture.
For the fuller picture, including how AI Overviews affect the rest of organic performance, the AI search analytics measurement stack covers GSC and GA4 setup plus a maturity model. A companion piece explains how AI Overviews impact SEO in more depth.
For a brand that gets named inside a ChatGPT answer instead of linked to, tracking ChatGPT mentions of your brand takes its own method beyond what GA4's channel captures. Mission Growth's platform tracks AI citations and visibility for customers.
Reporting on a bad month without losing trust
A bad month belongs in the report with three things stated plainly.
State what caused it, what has already changed in response, and when the improvement should show up. Here's the structure:
- Name the cause. State the specific driver, a lost featured snippet, an algorithm update, a site migration, instead of a vague "rankings fluctuated."
- State the response. Say what's already been done about it, not what you're planning to eventually look into.
- Give a date. Commit to when the next report should reflect the change, so the reader isn't left guessing whether this is fixed or ongoing.
Applied: "Traffic to the pricing page dropped after a March core update reweighted pages full of reviews above ours; we added three customer case studies this week, and expect partial recovery by the May report."
That sentence names the cause, the response and the date in one breath. It's the shape every paragraph reporting a bad month should follow.
Automating SEO reporting without losing the narrative
Automate the report once its data pull and layout repeat unchanged for a third consecutive period.
Keep it manual while goals, metrics or the audience are still being defined. Automating too early locks in a structure before you know it's the right one.
Automate once:
- The same metrics get pulled from the same sources every period.
- The layout hasn't changed for three periods running.
- The narrative sections are short, repeatable summaries rather than deep analysis.
Keep manual while:
- Goals or KPIs are still being negotiated with the stakeholder.
- The audience or cadence just changed.
- Explaining a bad month needs judgment a template can't supply.
A live dashboard can carry the numbers that update on their own, so the report itself stays focused on narrative and next steps. Building one is a separate project, covered in how to build an SEO dashboard.
Once you're ready to act on what the report surfaces, the AI SEO checklist turns the findings into a task list. Delivery mechanics, a shared link, a PDF, a slide deck, matter less than whether the report answers the reader's actual question.
Frequently asked questions
Use a three-part structure: name the specific cause, state what's already changed in response, and give a date for when the improvement should show up. Skipping any one of the three reads as either evasive or unfinished.
Weekly reports go to the technical team for incident response. Monthly reports go to a client or stakeholder as the default retainer cadence. Quarterly reports go to leadership for budget and strategic-direction decisions.
Yes. Google's Search Console Generative AI performance report (impressions, worldwide since August 2026) and GA4's AI Assistant channel (referral visits, added May 2026) measure different traffic that doesn't overlap, so include both as separate lines.
Automate once the data pull and layout have repeated unchanged for a third consecutive period. Keep the report manual while goals, metrics or the audience are still being defined, since automating early locks in a structure too soon.
At minimum: ranking movement, an organic traffic snapshot and a technical health line, whatever the cadence. The monthly and quarterly versions add conversions, backlinks and a competitor benchmark on top of that shared core.
How often to send SEO reports comes down to audience, not a fixed rule: weekly for a technical team on active work, monthly for a client or stakeholder by default, quarterly for a leadership review that needs a trend that matters for budget.
Cadence and audience decide an SEO report's structure before a single metric does.
Match cadence to audience, copy the template that fits, and translate every metric through the narrative table before you send it. That's what seo reporting best practices come down to: a report built for the person reading it. Start with the matrix above.
Figures and images in this post are free to reuse under CC BY 4.0 with credit to Mission Growth.
Get Mission Growth highlighted in your Google results.