AI Search Visibility KPIs: Which Metrics Belong in a Report
AI search visibility KPIs only mean something once you know their denominators. See what each number divides by, what moves it, and what belongs in a report.

On this page
Ask Google's AI Overview what AI search visibility KPIs are, and it already hands you seven names: visibility rate, share of voice, citation share, recommendation rank, sentiment, referral traffic. That list is the easy 20% of how to measure AI search visibility.
The hard part starts once you have a number. You've got a vendor dashboard, a prompt panel you built yourself, or GA4's AI Assistant channel running, and each one produces a figure.
None of them tells you whether that figure means what you think it means, or whether it moved because of your brand. None tells you whether it survives a stakeholder asking "why did this change?"
Ask what metrics measure success in AI search engines and you get a list of names back. The answer is narrower: the number you can still defend when someone questions it.
In this guide:
- Which tier each KPI belongs to, and why one blended score hides the answer
- What a mention rate or citation share actually divides by
- How much of a week-over-week move is the engine, not your brand
- The three-part rule for what earns a place in a report
What AI search visibility KPIs measure, and why one number can't cover it
AI search visibility KPIs split into three tiers: whether a brand is seen, how it's represented when it is, and whether that representation pays off.
No single blended score answers all three questions at once.
Here is how the AI search visibility metrics stack up across those tiers, using the names three separate sources already publish:
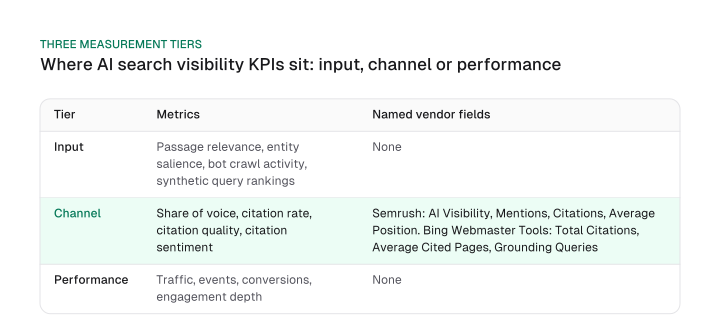
The input tier asks whether content is even structurally ready to be pulled into an answer: passage relevance, entity salience, bot crawl activity, synthetic query rankings.
The channel tier is where most tracking tools cluster: share of voice, citation rate, citation quality, citation sentiment. It also carries the named fields vendors publish, Semrush's AI Visibility, Mentions, Citations and Average Position, and Bing Webmaster Tools' Total Citations, Average Cited Pages and Grounding Queries.
The performance tier closes the loop with the AI search performance metrics a revenue owner already recognises: traffic, events, conversions, engagement depth.
Sorting a KPI into its tier first is the single most useful filter for reading it correctly. A metric that only answers "can this get pulled in at all" often gets reported as if it answered "did this make money." That mismatch is the most common mistake in this kind of reporting.
The channel tier is also where most disagreement lives. It splits into its own four dimensions, mention rate and share of voice, sentiment, citation-source analysis, and competitor benchmarking, covered on the four dimensions of AI visibility.
What a raw citation count can and can't prove about a brand, separate from a mention or a recommendation, is covered in what a citation count can and can't prove. This post picks up one level under both: the arithmetic that makes two tools disagree about the same brand in the same week.
Two channel-tier inputs sit outside this post's scope. How a brand is represented once it's visible, its tone and context accuracy, is a separate KPI layer: brand sentiment in AI answers.
How many people ask a question in the first place is a sizing input a report can reference rather than a visibility KPI, and prompt volume is the metric that estimates it.
These are the same three questions a classic SEO report always asked: are we seen, how are we represented, did it pay off. What changed is which engine decides the answer; the shape of the question hasn't moved.
Reading a visibility-tier number: what a mention rate or share of voice actually divides by
A mention rate or share of voice number is only as trustworthy as its denominator.
The same brand can show two very different percentages in two dashboards for the identical week, and neither number is wrong: the tools counted against different populations.
For the exact formulas behind mention rate, citation rate, AI share of voice and AI-referral conversion rate, see ai search analytics' mention rate and citation rate formulas. What follows is the layer underneath: what each number actually divides by.
A visibility-tier percentage can come from one of three populations:
- A fixed prompt panel the tool runs itself. A set number of prompts, run on a set cadence, versioned so this week's panel matches last week's.
- A live query sample the platform decides to show. The denominator shifts whenever the platform changes which queries it surfaces.
- A stated competitor set. Share of voice against five named competitors is a different number than share of voice against fifty.
A percentage built on any of these three tells you your exposure frequency inside that specific population. It never tells you a market-wide share, because no tool samples the whole market.
One reader put the resulting confusion bluntly on Reddit in July 2026: sat through six "AI search optimization" pitches, every one sold a visibility score, and nobody could explain how it's calculated.
That complaint has a fix. Before comparing two dashboards, or averaging them, log which of the three populations produced each number.
A mention rate percentage against a fixed prompt panel and a share of voice percentage against a live query sample measure two different populations, not two conflicting readings of the same one. Treat them as two separate numbers, never as an average.
Recommendation rank carries its own version of this problem. Semrush's Average Position field describes "where a citation of your domain typically appears in AI-generated responses for tracked prompts," which assumes the citations have a stable order.
Many conversational answers list several sources with no visible ranking at all. Position 1 in that list doesn't carry the click-through weight position 1 carries in a classic search result, and nothing guarantees the model treated the first-listed source as more important than the third.
Reading a citation-tier number: the denominator, and how much of a change is the engine's doing
A citation-tier number counts a brand's appearances against a specific, engine-defined population.
Bing Webmaster Tools' Citation Share, for example, divides your citations by every citation Bing itself already decided to show for the same grounding query. A large share of any week-over-week move in that number comes from the engine's own citation set turning over rather than from the brand.
Bing shipped that population definition alongside the metric itself. Its AI Performance report entered public preview on 2026-02-10, reporting Total Citations, Average Cited Pages, Grounding Queries and page-level citation activity.
Citation Share followed on 2026-06-16, defined exactly as "the percentage of citations attributed to your site out of all citations shown across all sites for that same grounding query." The same release added Intents, Topics and Compare: Intents classifies grounding queries into categories, Topics groups related queries into thematic clusters, and Compare overlays a prior period on the current one.
That denominator, and only that denominator, is what a Citation Share percentage measures.
How much of a week-over-week move in that number is the engine reshuffling its own sources? SISTRIX measured it directly across a 17-week study covering 82,619 qualified prompts and 1,548,213 snapshots in six countries.
Weekly domain-level citation churn ran about 5% for Google AI Overviews and about 74% for ChatGPT Search.
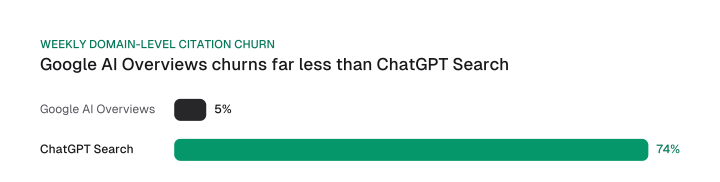
On ChatGPT Search, most weeks reshuffle the majority of the cited domain set regardless of anything the brand did. A citation-share drop that stays inside that baseline churn rate is noise.
Only a drop well past it, sustained across more than one week, is worth investigating as a brand-side change.
Before comparing two citation numbers, name the population behind each one (whose citation set, over what query set) and check any move against the engine's own baseline churn first.
The exact vocabulary a tracking engagement should pin down before any of this, mention versus citation versus recommendation versus baseline movement, is covered in what an ai seo services tracking deliverable should define. This section only covers the population math underneath one of those terms.
What moves your numbers that has nothing to do with your brand
A platform's own model swap moves AI visibility KPIs independent of the brand, and it can be large enough to erase nearly half of a tracked citation list.
Some of the smaller, day-to-day noise is just non-determinism: run the same prompt panel twice and you can get different citations, because each answer is generated fresh rather than looked up against a fixed ranking. For the sample size that averages it out, see how many prompts you need to track.
The confound that does real damage works on a longer timescale.
One study covering 100,000 keywords across 20 niches, sampled in January 2026 before Gemini 3 became the default model and again in February after it, found that 42.4% of the domains cited in Google's AI Overviews beforehand no longer appeared afterward.
The figure comes from SE Ranking's own analysis, which counted only the sources shown in the AI Overview's panel, not inline links, and which its authors call one interpretation among others. A default-model change did that on its own, with no change on the brand's side at all.
The second confound works across engines rather than across time: the same signal doesn't predict visibility equally everywhere. Ahrefs' July 2025 study measured how well the volume of branded web mentions predicts AI visibility, by engine.
The correlation is strong on Google AI Overviews, rho=0.65. It's weak on Perplexity, rho=0.30. On ChatGPT it's barely there, rho=0.15.
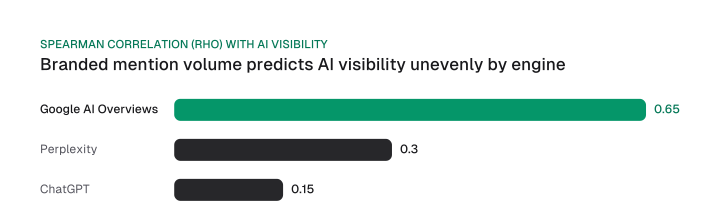
Divide the two ends of that range, 0.65 against 0.15, and the volume of branded web mentions is roughly 4.3x more predictive on Google AI Overviews than on ChatGPT.
Build a visibility strategy around the volume of branded web mentions and treat every engine the same way, and you're relying on a signal that barely holds on one of your three engines.
Before you read any week-over-week move as a brand signal, rule out both confounds first: is this ordinary non-determinism, or did the model behind the engine change?
If you need the exact dates a given engine last swapped models, the Google AI Mode model-version timeline tracks that history in full.
Which KPIs belong in a board report
Not every one of the KPIs for AI search visibility earns a place in a board report.
The ones that do share three traits: one fixed denominator, at least three to four weeks of the same measurement behind them, and a comparison against their own prior baseline rather than another tool's absolute number.
| Condition | What it rules out |
|---|---|
| One fixed denominator | A number whose population shifts between snapshots, this week's live query sample against last month's fixed panel |
| Three to four weeks of the same measurement | A single-day snapshot, or a metric that changed mid-quarter because the tool or panel size changed |
| Compared against its own baseline | Two tools' absolute scores set side by side as if they measured the same population |
Here's the rule applied to an actual reconciliation. Say your prompt panel shows one mention-rate reading this week, and Bing Webmaster Tools shows a different Citation Share reading for the same week.
That gap is not a contradiction to resolve into one number. The two readings come from two different denominators, a prompt panel you control against every citation Bing decided to show for that grounding query.
Log them as two lines trended against their own history. Averaging them into one blended score destroys the only information either reading carried.
That blended-score habit, along with reporting a visibility number with no competitor benchmarking behind it, is the fastest way to lose a stakeholder's trust in the whole line item.
A number a board can't act on gets cut from the next report anyway. Better to cut it yourself, or reframe it against its own baseline, before someone else does.
Deciding whether to build this measurement yourself or buy it? Mission Growth's platform tracks AI citations and visibility for customers.
Where that line sits inside a broader report, next to organic sessions and rankings, is covered in AI visibility in SEO reports. The one business-impact formula this section references but doesn't re-derive, ai referral traffic tracking, belongs in the same performance tier as the rest of this report's numbers.
None of the seven metric names an AI Overview hands a searcher is wrong. What's missing is which of those numbers share a denominator across tools, which move because an engine reshuffled its own sources, and which one survives a stakeholder asking why it changed.
Before your next report, write down the denominator behind every AI visibility number you already track, and drop any number whose denominator changed between snapshots.
Frequently asked questions
Two tools rarely count the same thing. One might use a fixed prompt panel and mention-only counting, another a live query sample and citation-based counting. Even with the same counting rule, different denominators alone can produce different percentages for an identical week.
No universal benchmark holds across tools or engines, so the useful comparison is your own score against your own baseline. For the specific branded AI visibility score some vendors publish, see that page's own breakdown.
Average weekly for internal tracking, since single-day snapshots are noise. Report monthly to stakeholders, and reset your competitor benchmarks quarterly, when enough weeks have accumulated to separate a real trend from ordinary non-determinism.
Because a large share of that change is the engine's own citation set turning over. SISTRIX measured weekly domain-level citation churn at about 5% for Google AI Overviews but about 74% for ChatGPT Search, so on ChatGPT most weeks reshuffle the majority of cited domains regardless of the brand.
Visibility measures whether an engine names or cites a brand at all. Referral traffic measures only the fraction of that exposure that produced a click, which under-counts AI search structurally since most exposure never generates a visit. Full formulas and GA4 setup live in ai search analytics.
That's a distinct KPI tier from visibility and citation counts, covering tone, context accuracy and reputation risk rather than exposure frequency. Brand sentiment in AI answers has its own methodology, separate from the denominator questions this page covers.
Figures and images in this post are free to reuse under CC BY 4.0 with credit to Mission Growth.
Get Mission Growth highlighted in your Google results.