AI Prompt Volume: What It Means and When to Trust It
AI prompt volume estimates how often people ask AI engines about a topic. Here's how the number gets built, its real margin of error, and when to trust it.

On this page
You open an AI visibility dashboard and see a number next to your category. Is it big? Is it made up? Nothing on the screen tells you which.
AI prompt volume is a modeled estimate of how often people ask AI engines like ChatGPT, Gemini, Claude and Perplexity about a topic, not a count pulled from a query log. No AI company publishes one.
So every vendor selling this number builds its own approximation from a panel, a broker feed or a set of real user questions. Each approximation carries a different margin of error, depending on how many raw observations sit behind the one topic you're actually checking.
That's the question worth answering before the number goes into a report or a content brief: not whether the vendor is "accurate" in general, but whether this specific topic has enough observations behind it to mean anything, and whether the screen in front of you is even measuring demand or something else entirely.
In this guide:
- What "AI prompt volume" actually means, and the second, unrelated thing the same two words name
- How three named vendors build the number from three different data foundations
- Why the error on a modeled count shrinks with the square root of the observations behind it, not the panel's headline size
- How prompt volume differs from Google search volume, and how many AI prompts get sent each day
- A two-minute test for validating any vendor's prompt volume data before you trust it
What is AI prompt volume?
AI prompt volume is a modeled estimate of how often people ask AI engines like ChatGPT, Gemini, Claude and Perplexity about a topic.
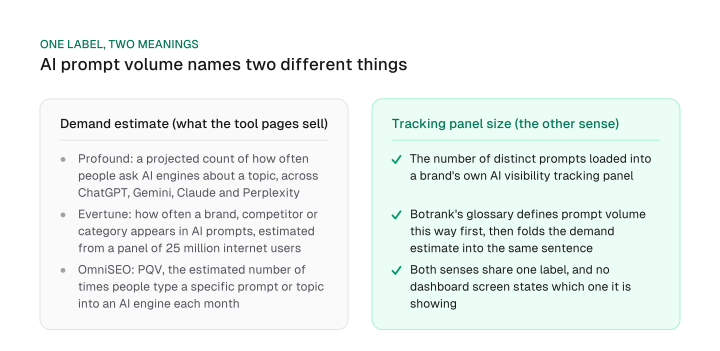
If you searched "what is prompt volume" and landed here, this is the sense the tool pages mean. Profound, Evertune and OmniSEO all use it this way: a projected count of demand for a topic inside AI conversations, refreshed on a schedule and broken out by engine. Some vendors label the same idea "ai search volume" instead.
If you came here from a rank-tracking tool roundup, note that a few of those pages use "prompt volume" for something narrower: how many prompts a pricing tier lets you track. Market demand, the sense covered from here on, is a different object entirely.
The same two words also name something else. Botrank's glossary defines prompt volume as "the number of distinct prompts included in a tracking panel used to measure AI visibility, or, in a related sense, the estimated frequency with which real users ask AI engines questions relevant to a given topic or industry." Its FAQ repeats the pairing.
One sentence, both senses. No dashboard label tells you which one you're looking at.
Here's the two-question test. First: does the number move only when you add or remove prompts from a list you built yourself? Then you're looking at panel size, the sense behind how you track ChatGPT mentions with your own panel, sized to your own brand's list.
Second: does the number come from a vendor's page describing a data source you don't control, millions of panelists or a topic-clustering method? Then it's the demand estimate, the sense covered from here on.
How AI prompt volume gets built
AI prompt volume comes from panels, extrapolation and topic clustering, not from a query log, because no AI company publishes one.
ChatGPT, Gemini, Claude and Perplexity don't release anything like Google Search Console's query data, so every one of these prompt volume tools has to reconstruct demand from a different starting point.
Three vendors' own pages, each independently re-verified in September 2026, show three different foundations for the same metric:
| Vendor | Data foundation | Refresh cadence | Coverage |
|---|---|---|---|
| Profound | Double opt-in consumer panel, anonymized, GDPR/CCPA compliant | Weekly, under one week latency | ChatGPT, Gemini, Claude, Perplexity; US, UK, Canada, Germany, France "and more" |
| Evertune | A panel Evertune describes as 25 million internet users' real-world activity | Reports trends over time; no fixed cadence stated on the page | All major AI models |
| SISTRIX | 62 million real user questions from Google Search and other sources, clustered into 1.4 million topics | No fixed cadence stated; SISTRIX calls the resulting number "an approximation" | Derived from Google Search demand, not an AI usage panel |
None of these three counts individual prompts the way Google Keyword Planner counts searches.
Profound recruits a consumer panel and watches what it actually types into AI engines. Evertune extrapolates from what it describes as the real-world activity of 25 million internet users. SISTRIX starts somewhere else entirely: it clusters millions of real Google Search questions into topics, then calls the AI number built on that base an approximation rather than a panel-observed count.
That base, not the size a vendor advertises, decides which topics its number can see. A panel of double opt-in volunteers sees whatever those volunteers actually ask. A clustering method built on Google Search questions sees whatever people typed into Google, projected onto AI phrasing. Neither approach can see a topic it never captured to begin with, no matter how large the headline panel number is.
OmniSEO, which calls the same idea PQV (Prompt Query Volume), refreshes monthly on a rolling 30-day window rather than weekly. Cadence matters here: a topic that spikes and fades faster than a vendor's refresh cycle won't show up in the number until the next update, whatever base that vendor is measuring from.
Why a single prompt volume number can be off by a wide margin
A prompt volume number's error shrinks with the square root of how many raw observations back that specific topic, not with the size of the vendor's total panel.
This is the same property behind every opinion poll: your margin of error depends on how many people actually answered the specific question you're reading, not how many the pollster could theoretically reach.
Pew Research's own explainer puts a number on this. A simple random sample of 1,067 people carries a margin of error of about ±3 percentage points. Pull a subgroup of roughly 160 of those people, around 15% of the sample, and the margin of error on that subgroup alone widens to about ±8 percentage points.
Same poll, same pollster, same total sample. How many observations sit behind one specific result determines its error, regardless of the sample the pollster started with.
The same relationship governs a prompt volume number. A vendor with a panel of millions can still have almost nothing behind one narrow topic if few of its panelists ever asked about it. Traditional keyword tools ran into a version of this decades earlier: a modeled search-volume figure for a term with too few real searches to sample stays unreliable no matter how large the underlying panel is.
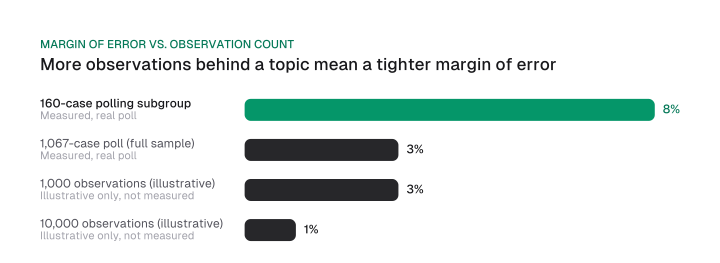
Here's the check to run before you trust an absolute number. Going from 40 observations to 10,000 cuts the relative error roughly sixteenfold, from about 16% down to about 1%, an illustrative application of the same 1/sqrt(n) relationship.
That ratio lines up with Pew's own numbers: take the square root of 1,067 divided by 160 and you get about 2.58, close to Pew's stated ±8-to-±3 ratio of 2.67 once you allow for rounding. These particular figures show how the math moves; they aren't a claim about any named vendor's real sample for your topic.
So ask the vendor how many raw observations back the one topic you're checking, not how big the total panel is. A tool that won't share that number is asking you to trust the panel headline instead of the count that actually sets your margin of error.
Is AI prompt volume the same as search volume?
AI prompt volume and Google's search demand measure different behavior, not the same demand counted twice, because people type short keywords into Google and hold full conversations with AI engines.
A Google query for "best running shoes" and a ChatGPT prompt that says "I run three times a week on pavement, my knees ache, what shoes should I look at" are both about running shoes.
They carry a completely different amount of context, though, and a keyword list built for one doesn't reconstruct the other. This is the fuller answer to prompt volume vs search volume: the gap isn't accuracy, it comes down to what each format captures.
One AI visibility vendor ran a rewriting test across three engines, ChatGPT, Copilot and Perplexity, sending each the same batch of 10,000 prompts. ChatGPT turned 91% of them into unique queries, with only 13% word overlap against the original prompt.
That's the mechanism behind why the two metrics diverge. AI engines rewrite what you ask before they go looking for an answer, a process Google runs on its own side through Google's query fan-out process, breaking one question into several targeted searches behind the scenes.
The underlying demand shape is different too. NBER's working paper on how people use ChatGPT found that "Practical Guidance," "Seeking Information" and "Writing" account for nearly 80% of all conversations combined, a mix skewed toward open-ended help rather than Google's mostly navigational and transactional query traffic.
A keyword list pulled from Search Console won't surface that kind of demand. It shows up only as a paragraph-long conversation about a problem, never as a query.
| Google search volume | AI prompt volume | |
|---|---|---|
| Input | Short keyword phrases | Full-sentence conversations, often with context |
| Data source | Google's own logged query data | Panels, broker feeds or topic clustering |
| Rewriting | Minimal; the query stays close to what was typed | AI engines rewrite the prompt into different queries before retrieving anything |
| Dominant topics | Navigational and transactional | Practical guidance, information-seeking, writing |
The table's point in one line: this isn't the same demand counted through two lenses, it's two adjacent but distinct behaviors. Treating a prompt volume number as a drop-in replacement for keyword research skips both the rewriting step and the different mix of topics behind it.
How many AI prompts are sent per day
ChatGPT alone carried about 18 billion messages a week from 700 million weekly users in July 2025, according to NBER.
That's NBER Working Paper 34255, "How People Use ChatGPT," published in September 2025. Divide the weekly total by seven and you get roughly 2.57 billion messages a day, about 25.7 messages per active user across that same week.
That daily rate is close enough to explain the "2.5 billion prompts a day" figure you'll see repeated across the AI search space. The number is real: TechCrunch reported it in July 2025 under the headline "ChatGPT users send 2.5 billion prompts a day," scoped to ChatGPT at the source.
What falls off every time someone repeats it as an AI-wide total is that scope. It's one platform's message count from a single dated study, counting every follow-up message inside a conversation instead of unique topics or unique users.
That distinction matters for anything built on top of the number. A conversation with 15 back-and-forth messages about one problem inflates the message count without adding 15 topics worth tracking. If you're sizing the AI search opportunity for a report, treat the platform-specific message count as a starting point. For the wider adoption picture beyond this one figure, AI search statistics rounds up how fast AI search is growing.
Which AI engines and platforms prompt volume covers
Prompt volume tools mostly cover ChatGPT, Gemini, Claude and Perplexity, but "covers" doesn't mean "measures equally."
Every panel is built on a consumer user base that skews toward ChatGPT and toward personal, non work use.
Profound's own page lists exactly those four engines, and the other named vendors here describe a similar set. Engine coverage is a checkbox on a features page; panel composition is what actually decides whether your category gets measured well.
Here's why that distinction matters. NBER's data on ChatGPT usage shows non work messages grew from 53% to more than 70% of all usage between November 2022 and July 2025.
A consumer panel that mirrors that mix, recruited the way Profound and Evertune both describe (double opt-in and broad internet-user panels, not enterprise software users), will systematically undercount enterprise and niche B2B topics relative to their real professional search volume, whichever engines the tool claims to cover.
So a prompt volume number for a consumer topic like meal planning and one for enterprise data governance software aren't sitting on the same underlying sample size, even inside the same tool, even with the same four engines checked off. If you're weighing one of the best LLM SEO tools for a B2B category, ask what share of the panel's usage is actually work-related before you trust the topic-level number it shows you.
How to validate a prompt volume number before you trust it
Validating a prompt volume number means checking whether independent tools agree for independent reasons.
Agreement alone isn't the test: two tools showing roughly the same number for a topic feels like confirmation, but it only counts as confirmation when the two tools' underlying data actually comes from different places.
The mechanism goes back to a 1907 study by Francis Galton, published in Nature. Galton collected roughly 800 independent guesses at the dressed weight of an ox from fairgoers with no coordination between them. The median guess came in at 1,207 pounds against an actual weight of 1,198 pounds, off by less than 1%.
Independent errors in different directions cancel out once you aggregate enough of them; correlated errors don't. That's why a poll average beats any single poll: it only works when the polls are actually independent of each other.
Applied to prompt volume: before treating agreement between two or three tools as validation, check whether they use independent underlying data. Different panel vendors, different collection methods and different data foundations, a double opt-in consumer panel, a panel extrapolated from 25 million internet users' activity, a clustering method built on Google Search questions, count as independent.
If two tools quietly draw from the same upstream data broker, their agreement repeats one bias instead of canceling it. It shouldn't raise your confidence in the number at all.
You often can't verify independence directly. Browser-extension data, the supply chain several of these vendors' own methodology pages describe, gets purchased from data brokers and aggregators who each pull from dozens of extensions. Two tools can share an upstream source without either one naming it.
The practical version of the check: ask what data foundation backs each tool, and only count agreement as confirmation when the answers are genuinely different. Build the rest of your AI search analytics stack around signals you can confirm this way.
How to use prompt volume without overtrusting it
Use prompt volume to prioritize which topics to build for, not to size a market or justify a budget line. Its rank order is reliable; its absolute number isn't.
Everything above points the same way: the number is more accurate for direction than for magnitude, useful for relative comparison and trend detection inside one tool, and unsafe as an absolute count you would report as fact.
Match the use to the part of the number that's actually reliable:
| Use case | What's reliable | What to do |
|---|---|---|
| Prioritize which topics to build for first | Rank order within one tool, over time | Trust it; build for the topics that rank highest, rechecked periodically for trend direction |
| Report a number to leadership or a client | Neither rank order nor magnitude once quoted out of context | State it as an estimate with its source and date, never as a count |
| Size a market or justify a budget line | Magnitude | Don't use prompt volume for this; it wasn't built to answer it |
| Compare branded vs. unbranded demand for your category | Direction, within the same panel | Track the ratio over time inside one tool rather than the absolute split |
A common mistake sits in that second row: treating a modeled estimate as if it carries a query log's certainty, then reporting it upward that way. It doesn't, for every reason covered above, from panel composition to topic-level sample size to unverified cross-tool agreement.
If you want the certainty of your own logs instead of someone else's panel, that's a different object. Mission Growth's platform tracks AI citations and visibility for customers.
That's ground truth on your own brand rather than a market-wide estimate. For evaluating third-party options, the best AI visibility tools rounds up how the major players differ on exactly the coverage and methodology questions raised here.
The number on your screen is a modeled estimate built from someone else's panel. It stands in for a count you don't have. How much weight it deserves depends on the topic-level observations behind it and which of the term's two senses that screen is actually showing, not the vendor's name on the login page.
Before you cite it anywhere, run the n-check from the margin-of-error section above on the one topic you actually care about.
Frequently asked questions
There's no universal good number. Judge it by trend direction and by how a topic ranks against other topics inside the same tool over time, never by a category threshold on its own; the absolute figure carries too much modeling error to compare cleanly across tools or categories.
No. It's an additional demand signal for topics that never touch Google, separate from keyword-level Search data. The two measure different behavior (see the search-volume comparison above), so a content plan built only on one will miss what the other would have shown.
Vendors that build prompt volume from a consumer panel describe their own compliance on their own pages. Profound's page, for example, states its panel is double opt-in, anonymized and GDPR/CCPA compliant. That's a claim about Profound's own methodology, not a certification covering every tool that measures prompt volume, so check each vendor's own page.
NBER's September 2025 working paper found that ChatGPT alone carried about 18 billion messages a week, roughly 2.57 billion a day, from 700 million weekly users as of July 2025. The widely repeated "2.5 billion prompts a day" figure is TechCrunch's, reported in July 2025 and scoped to ChatGPT at the source; the NBER paper's weekly total works out to the same daily rate for the same platform.
Most tools cover ChatGPT, Gemini, Claude and Perplexity, with ChatGPT weighted heaviest because that's where the underlying consumer panels see the most usage in the first place. Coverage of an engine doesn't mean even measurement across every topic on it.
Figures and images in this post are free to reuse under CC BY 4.0 with credit to Mission Growth.
Get Mission Growth highlighted in your Google results.