AI SEO Statistics: Ranking Impact Studies
AI SEO impact ranking statistics, verified against primary sources: CTR studies, citation data, and the recycled numbers other roundups get wrong.
By Furkan AktaşPublished Updated
On this page
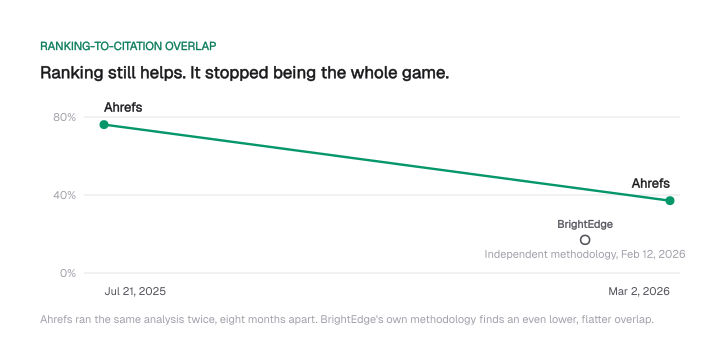
A page ranking in Google's organic top 10 had a 76.10% chance of also being cited in that query's AI Overview in July 2025. By March 2026, that chance was 37.10% (Ahrefs).
Zero-click searches climbed too: 68.01% of US Google queries ended without a click over the same stretch (SparkToro, June 2026). Those two numbers anchor every AI SEO impact ranking statistics page worth trusting.
Every stat below carries a named source and a date. We checked the most widely copied numbers against their primaries, and a section near the end names the ones that didn't survive.
If you landed here without the base vocabulary, start with our generative engine optimization guide and come back for the numbers.
Key AI SEO statistics at a glance
The numbers below are the ones worth bookmarking, each with its source and date:
Download CSV (CC BY 4.0)
Quote any row with its source and date attached.
How we verified these AI SEO impact ranking statistics
Most AI SEO statistics pages recycle each other: undated entries, missing source links, conflicting numbers side by side with no explanation. The copy chain is the product.
Our approach is different. Every number below traces to a named primary source with a publish date, or an access date where the page carries none.
We read each primary study directly, rather than trusting aggregator summaries. The primaries we checked ourselves:
- Both Ahrefs citation-overlap studies
- Seer Interactive's 2026 CTR update
- Both Pew Research Center analyses
- Amsive's CTR study
- Ahrefs' correlation study
- The original GEO paper on arXiv
Anything we couldn't confirm on a primary page is excluded or labeled unverified, never presented as fact.
One example: industry estimates put AI Mode's zero-click rate above 90%, credited to Semrush and to a Bain & Company survey. Semrush's own AI Mode study (69 million US desktop sessions, May 1 to July 5, 2025) traces cleanly to a fetchable primary and puts the figure at 92-94%.
The Bain & Company attribution doesn't trace back. Bain's own zero-click research, published February 19, 2025, reports 60% of searches ending without a click overall and carries no AI-Mode-specific number above 90%.
The AI search statistics below are grouped by theme. A corrections section near the end names the recycled numbers that didn't survive contact with their primaries.
AI answer adoption and zero-click search statistics
AI Overview statistics on adoption moved fast between 2025 and 2026, so dates matter here more than anywhere else:
- AI Overview trigger rates rose from roughly 30% to roughly 48% of tracked queries over the year to February 12, 2026, while overlap with organic results stayed what BrightEdge called "remarkably flat."
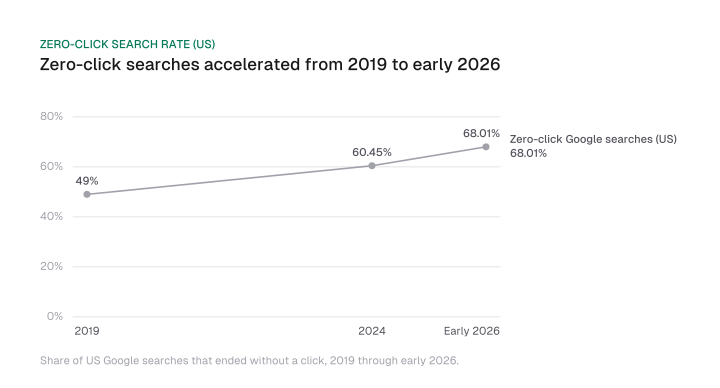
- Zero-click Google searches in the US climbed from 49% in 2019 to 60.45% in 2024 to 68.01% in early 2026, the fastest acceleration in the tracked decade (SparkToro, Rand Fishkin, June 9, 2026, updated June 18, 2026).
- SparkToro and Datos counted AI tools at 3.2% of US desktop searches across 41 major sites in the fourth quarter of 2025, against 73.7% for Google alone. The 210x Google-to-ChatGPT gap that circulates has no SparkToro page behind it, so quote the share instead.
Prompt counts are the shakiest family of numbers on this page, because no AI company publishes a query log and every figure is modeled from a panel. How those estimates get built, and the widely repeated daily figure that loses its scope in retelling, is ai prompt volume.
Search behavior shifted just as fast on the platform side:
- Heavy traditional-search use among Americans rose from 84% in Q1 2023 to 87% in Q1 2025; 95% still search at least monthly (SparkToro, August 26, 2025).
- AI-tool usage among that same group grew from 8% to 38% over the period, though growth has slowed since September 2024.
- ChatGPT reached 900 million weekly active users by February 27, 2026, up from 800 million in October 2025 and roughly double the 400 million from a year earlier (OpenAI).
- OpenAI also disclosed 50 million paying subscribers, 9 million paying business users, and a $110 billion funding round in that same announcement. ChatGPT SEO statistics age faster than any other group here, so treat anything older than two quarters as historical. Our ChatGPT usage statistics keep the newer figures dated.
- 58% of 900 tracked US adults ran at least one Google search in March 2025 that produced an AI-generated summary, out of a dataset of 68,879 unique queries, 12,593 of which triggered a summary (Pew Research Center, July 22, 2025).
- Gemini's user count depends on who you ask: one estimate from Alphabet's own disclosures puts it near 900 million monthly active users by May 2026, while TechCrunch reported 750 million MAU at the February 4, 2026 earnings call. Our Gemini market share breakdown dates each count and names its source.
- Google's own numbers: AI Mode passed 1 billion monthly users on May 19, 2026, and AI Overviews serve 2 billion+ monthly users. Our Google AI Mode statistics cover the usage and click figures behind it.
CTR impact of AI Overviews (and why the studies disagree)
AI Overviews lower click-through rate in every major study, and the size of the drop depends on the method. Ahrefs found 34.5% lower CTR across roughly 300,000 keywords (April 2025), Amsive measured -15.49% on keywords that started triggering an Overview (April 16, 2025), and Pew Research Center's real users clicked an organic result on 8% of visits with an AI summary against 15% without (July 22, 2025).
These AI Overview CTR statistics disagree because each AI SERP study measures a different thing: a keyword panel, the same keywords before and after, or real people's visits.
Seer Interactive's April 24, 2026 update tracked a 26% decline on AI Overview queries, and cited brands still earned roughly 120% more clicks per impression than uncited ones. Quote any of these numbers with its sample and date attached.
Each study's sample, window and conflicting figure, plus how often Overviews appear by intent and industry, is on our Google AI Overviews statistics page. For the tactical follow-up, our guide on how to show up in Google AI Overviews covers what cited pages do differently.
Citation-source patterns: who AI engines actually cite
AI citation statistics vary sharply by engine, so a single "AI cites X most" claim is nearly always wrong.
The largest dataset here comes from Averi and Profound's analysis of 680 million AI citations, collected August 2024 through June 2025 and published January 7, 2026.
A top-10 share is not a share of all citations; our ai citation statistics page converts each engine's top-10 figures into shares of everything it cites.
Here's the citation mix by engine:
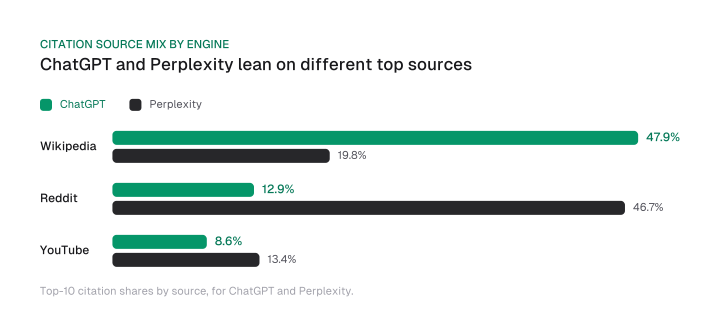
- ChatGPT's top-10 citation sources: Wikipedia 47.9%, Reddit 11.3%, Forbes 6.8%, G2 6.7%.
- Perplexity's top-10 citation sources: Reddit 46.7%, YouTube 13.9%, Gartner 7.0%.
- Google AI Overviews' top-10 citation sources: Reddit 21.0%, YouTube 18.8%, Quora 14.3%, with Wikipedia at 5.7%.
- Google AI Overviews and Google AI Mode share only 13.7% of cited sources, despite reaching semantically similar conclusions 86% of the time. Same answers, different pages.
- Only 11% of domains are cited by both ChatGPT and Perplexity. Largely separate ecosystems, which is why platform-specific work beats one generic pass.
- Across Perplexity's top-50 tracked citation sources (3.1M+ US queries), YouTube (32.4%), Reddit (16.6%), and Wikipedia (8.2%) account for over 57% of tracked citations (Ahrefs, June 1, 2026). For Perplexity's own revenue and user numbers, see our Perplexity statistics.
- Pew's real-user data adds a public-sector wrinkle: Wikipedia, YouTube, and Reddit together made up roughly 15% of links inside Google's AI summaries, while .gov sites were 6% of AI-summary links versus 2% of standard organic links (July 22, 2025).
The flagship number of this page sits here.
Ahrefs measured the overlap between Google's top-10 organic results and AI Overview citations at 76.10% on July 21, 2025 (1.9 million citations across 1 million AI Overviews) and 37.10% on March 2, 2026 (863,000 keyword SERPs, 4 million AI Overview URLs via Brand Radar).
Divide 37.10 by 76.10 and you get 48.8%: only about half of a top-10 ranking's predictive value for AI citation survived under eight months.
Two independent cross-checks back this up:
- BrightEdge, with its own methodology, puts the share of AI-Overview-cited sources that also rank in the organic top 10 at about 17%, describing it as "remarkably flat" across its tracking window (February 12, 2026). Lower than Ahrefs' figure, same direction.
- Where the citation comes from on the page matters: 55% of AI Overview citations pull from the top 30% of the source page, 24% from the middle third, and 21% from the bottom third (CXL, March 26, 2026). Put the quotable answer high.
What correlates with getting cited: ranking-factor statistics
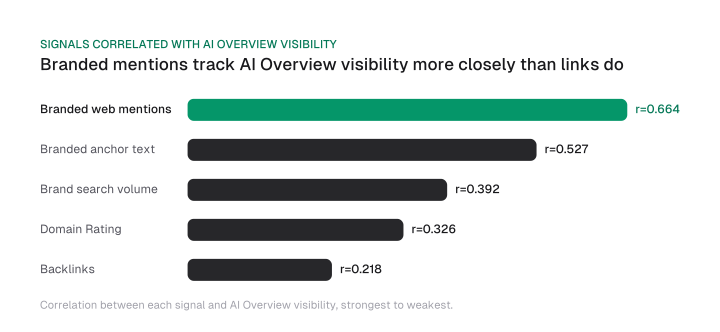
Branded mentions, not links, are the strongest measured correlate of an AI Overview citation.
The closest thing to generative engine optimization statistics with real experimental or correlational design comes from an Ahrefs correlation study and the academic paper that named the field:
- Branded web mentions correlate at r=0.664 with appearing in an AI Overview, and branded anchor text at r=0.527, the two strongest signals in Ahrefs' analysis (May 26, 2025).
- The same primary page also lists brand search volume at r=0.392, backlinks at r=0.218, and Domain Rating at r=0.326, all well below the two mention-based signals. Brand mentions beat link-based signals by a wide margin in this dataset.
- Response-level optimization, citing credible sources and adding relevant statistics or quotations, improved a source's visibility in AI-generated answers by up to 40% (Aggarwal, Murahari, Rajpurohit, Kalyan, Narasimhan, and Deshpande, arXiv:2311.09735, 2023). Cite the arXiv paper itself rather than secondhand characterizations of it.
Access control is the other side of the citation equation, here's what the crawler snapshots show:
- GPTBot appears in 13.8% of analyzed robots.txt files, ClaudeBot in 11.5%, CCBot in 11.2%, and Google-Extended in 10.7%, from a snapshot of 4,047 robots.txt files taken March 30, 2026.
- llms.txt adoption sits at 8.7% of the top 1,000 websites (87 of 1,000 domains), rising to 15.8% among the 549 sites in that sample that were reachable (Rankability, June 23, 2026, updated June 29, 2026). You can test your own file in about a minute with our free llms.txt checker.
Business and budget shift statistics
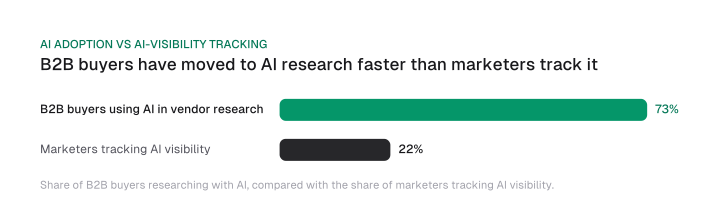
B2B buyers have moved to AI research faster than marketers have moved to measuring it:
- 73% of B2B buyers now use AI tools such as ChatGPT and Perplexity during vendor research (Loganix, April 3, 2026).
- Only 22% of marketers currently track AI visibility, and fewer than 26% plan to develop content specifically for AI citations, from the same Loganix release.
- Derived from those two same-release numbers: a 51-percentage-point gap, with buyer AI adoption running at roughly 3.3x the rate of marketer AI-visibility measurement (73 divided by 22).
- 61% of the B2B buying journey completes before the buyer ever contacts a vendor (Forrester survey of 4,000+ buyers, cited in the Loganix release above).
The job market tells a related but separate story:
- SEO job listings fell 37% year-over-year comparing Q1 2024 to Q1 2023, based on 80,000+ listings from 4,700 employers, in Nick LeRoy's analysis. Date this one carefully: it's the 2024 scare, now historical.
- The 2026 picture looks recomposed rather than collapsed. Semrush's analysis of 3,900 SEO job listings on Indeed (March 30, 2026) found senior leadership roles at 59% of listings, at a $130,000 median salary versus $71,630 for other roles.
- General AI-skill mentions appear in 31% of senior listings versus 22.3% of the rest; AI-search-specific skills (SGE, AEO) show up in only 6.3% and 3.7% of listings respectively.
- The global SEO services market is valued at approximately $83.98 billion in 2026, growing at a 12.12% CAGR (Mordor Intelligence). Other firms publish $108B-$134B estimates under different market-scope definitions, so name the firm whenever you quote a market size.
- Microsoft's study of 200,000+ Bing Copilot conversations gives each occupation an AI applicability score: Writers and Authors 0.454, Public Relations Specialists 0.365, and Market Research Analysts and Marketing Specialists 0.350, the occupation that holds SEO strategists. Microsoft says relative comparisons mean more than absolute values, so read the scores as a ranking, not a share of tasks.
- Perplexity's own Comet Plus announcement of August 25, 2025 says all Comet Plus revenue goes to participating publishers, minus a small portion for compute. The 80% publisher share comes from Perplexity's statements to press and the $42.5 million pool from Bloomberg and the Wall Street Journal.
For the argument these numbers feed, will AI replace SEO works through the job-market and adoption data in full.
What you can measure today: AI search analytics statistics
Google Search Console shipped a dedicated Generative AI performance report on June 3, 2026, covering AI Overviews and AI Mode. What it shows:
- Version one reports impressions only: no clicks, CTR, position, or query data. It groups by pages, countries, dates, and devices, with history starting May 18, 2026 and no backfill.
- Ahrefs' Brand Radar tracks 405 million+ search-backed prompts across six AI engines (Google AI Overviews, AI Mode, ChatGPT, Perplexity, Gemini, Copilot; Grok collection is temporarily suspended). AI-chatbot source data begins May 2025; AI Overviews data begins August 2024.
- Semrush's AI Visibility Index launched September 8, 2025, analyzing roughly 2,500 real-world prompts across 100 brands in 5 industries. Its 2026 edition expanded to 126 million US AI search prompts analyzed January through April 2026.
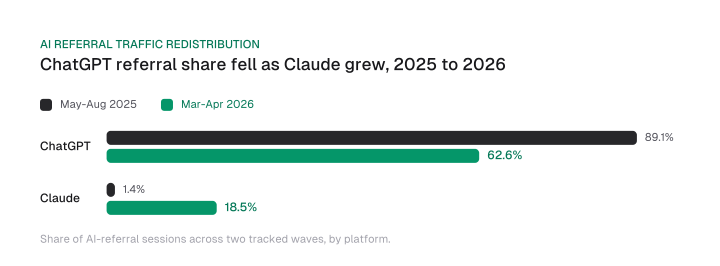
- AI referral traffic redistributed sharply between mid-2025 and early 2026. ChatGPT's average share of AI-referral sessions fell from 89.1% (May-August 2025, 41-brand panel, 2.8M+ sessions) to 62.6% (March-April 2026).
- Claude's share grew from 1.4% to 18.5% over that stretch, roughly 13x. Gemini reached 10.6%, Perplexity 7.3%, and Copilot 4.0% in the later wave (Higoodie, May 21, 2026). For Claude's own usage and revenue figures, see our Claude AI statistics.
Mission Growth's platform tracks AI citations and visibility for customers. An "AI visibility" number means nothing until you know which engines, which prompts, and which date range produced it.
For the full measurement-stack framework, see AI search analytics, and if your analytics baseline itself is shaky, run the free tracker audit first.
AI crawler access and trust statistics
Cloudflare caught Perplexity running an undeclared, spoofed-user-agent crawler that rotated IPs across networks to bypass robots.txt and firewall blocks on Cloudflare's own test domains. The scale:
- Cloudflare estimated 3-6 million daily requests from that stealth crawler versus 20-25 million a day from Perplexity's declared crawlers, observed across tens of thousands of domains in an August 4, 2025 report that says both the declared and the undeclared crawlers scraped contrary to the web crawling norms in RFC 9309.
- Cloudflare de-listed Perplexity as a verified bot in response.
- Perplexity's own developer documentation distinguishes PerplexityBot, a declared indexing crawler that respects robots.txt, from Perplexity-User, a user-initiated live-fetch agent with different robots.txt behavior. Both publish their IP ranges as JSON.
One first-party note on the access side: we migrated our own React single-page app to prerendered static HTML for 20 marketing pages because AI crawlers don't execute JavaScript.
Access statistics only matter if the crawler that arrives can read what you serve. For the full picture on Perplexity's crawler behavior and what to do about it, see our Perplexity SEO guide. For dated crawler shares across panels and the training versus search split, see our ai crawler statistics.
Statistics AI SEO roundups quote without context (and what the primary source actually says)
Seven statistics below circulate across AI SEO roundups stripped of the date, sample or study that produced them.
Each item covers the number as it circulates, what the primary source actually says, and why it matters.
1. "AI Overviews cut organic CTR by 61%"
The number you'll see: organic CTR fell 61%, from 1.76% to 0.61%, when an AI Overview is present.
It circulates across several aggregator roundups as if it were a live number, but it traces cleanly to one named study: Seer Interactive's own September 2025 update.
What we found: the number is real, just superseded. Seer Interactive's own September 2025 update (3,119 terms, 42 client organizations, June 2024 to September 2025) reports exactly this: on AI-Overview queries, organic CTR went from 1.76% down to 0.61%.
Seer's later April 24, 2026 update, on a different sample and window (53 brands, 5.47M queries, January 2025 to February 2026), reports a smaller 26% decline (3.19% to 2.36%).
Ahrefs measured -34.5% (April 2025) and Amsive -15.49% (April 16, 2025), different studies entirely. Quote -61% with its September 2025 date attached, or it reads as this month's number.
2. "Brands cited in AI Overviews earn 35% more organic clicks and 91% more paid clicks"
The number you'll see: the 35%/91% pair appears across several 2026 roundups, most with no source attached.
What we found: the pair traces to Seer Interactive's September 2025 update: brands cited in an AI Overview beat uncited brands by 35% on organic clicks and by 91% on paid clicks in that update (organic CTR 0.70% cited versus 0.52% uncited; paid CTR 7.89% versus 4.14%).
Seer's later April 24, 2026 update, a different sample and window, reports a narrower comparison instead: cited brands earned roughly 120% more organic clicks per impression than uncited brands (53 brands, 5.47M queries, January 2025 to February 2026).
Both are legitimate Seer numbers; the sample and date decide which one you're quoting.
3. "ChatGPT drives 87.4% of all AI referral traffic"
The number you'll see: attributed to Conductor, 2025, usually with no date and no primary link.
What we found: the dated panel data says the share is falling, fast. Higoodie's report (May 21, 2026) measured ChatGPT's AI-referral share at 89.1% for May-August 2025, then 62.6% for March-April 2026. A static 87.4% quoted in mid-2026 is stale on arrival.
4. "ChatGPT holds 4.33% of search market share"
The number you'll see: 4.33%, an October 2024 estimate built on SimilarWeb and Datos data via Rand Fishkin, still quoted as current on multiple blogs.
What we found: Fishkin himself publicly downplayed the figure, since not every prompt counts as a search, and tighter-methodology estimates put the real figure closer to 0.25%.
The scale backs this up: SparkToro and Datos put all AI tools together at 3.2% of US desktop searches across 41 major sites in the fourth quarter of 2025. Counted by OpenAI's own message classification, information-seeking messages run about 617 million a day, so ChatGPT's share depends on which messages you count. Our ChatGPT vs Google market share breakdown sets each method side by side.
5. The 76% to "38%" rounding drift
The number you'll see: "top-10 rankings overlap with AI Overview citations 38% of the time," sometimes 37.9%.
What we found: the primary Ahrefs figure from March 2, 2026 is 37.10%. The drift from 37.10 to 37.9 to 38 is small, but it's a fingerprint: a page citing "38%" with no date or study link is quoting someone else's quote of the study.
Use 37.10%, the share of AI Overview citations that also rank in the organic top 10, against the July 21, 2025 baseline of 76.10%.
6. Trigger rates of "13%, 25%, and 48%" presented as rivals
The numbers you'll see: at least one competitor page lists AI Overview trigger rates of 13%, 25%, and 48% side by side with no reconciliation.
What we found: they're three different studies measuring different things at different times. The 13% figure is an early-2025 Semrush snapshot. 25.11% is Conductor's own figure, from its 2026 AEO/GEO Benchmarks Report: 5.5 million of 21.9 million Google searches analyzed generated an AI Overview, over a four-week window from September 15 to October 12, 2025.
Roughly 48% is BrightEdge's February 2026 trigger rate after a year of growth from roughly 30%. Name the study and date, and the "conflict" disappears.
7. Bonus: two we refuse to print as fact
The claim that publishers posting weekly or more see 67% higher AI citation rates is cited by HubSpot and traced to "CMI's 2024 research." A primary CMI report doesn't surface.
If you quote it, cite the original study and its date alongside the number.
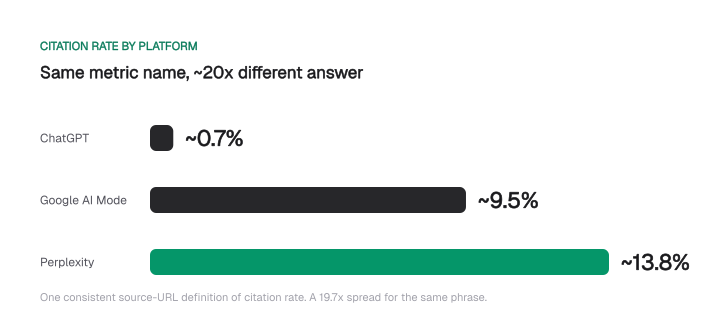
Citation rate barely works as a cross-platform metric, either. Under one consistent source-URL definition, RanketAI's aggregation shows roughly 0.7% for ChatGPT, 9.5% for Google AI Mode, and 13.8% for Perplexity (April 10, 2026, updated June 9, 2026).
That's a 19.7x spread, 13.8 divided by 0.7, for the same phrase.
RanketAI aggregates third-party benchmarks without publishing its own methodology. It illustrates the definitional mess rather than settling it.
What to do with these numbers
Three moves follow directly from the data: structure quotable answers high on the page, invest in branded mentions, and start measuring AI visibility now.
Structure quotable answers in the top third of the page: 55% of AI Overview citations pull from there (CXL, March 26, 2026).
Invest in branded mentions, the strongest measured correlate of AI visibility at r=0.664 (Ahrefs, May 26, 2025).
And start measuring now. 73% of your B2B buyers already research with AI while only 22% of your peers track it (Loganix, April 3, 2026).
This page stays deliberately backward-looking: measured numbers, dated sources. For what the same data suggests comes next, read AI SEO trends 2026. For the budget side of the business case, see what the average SEO ROI looks like and what that median leaves out.
When you cite a stat from here, carry the source name and date with it. That habit is the entire difference between this page and the roundups it corrects.
Frequently asked questions
Do AI Overviews actually reduce click-through rate?
Yes, in every major study, though the magnitude varies with methodology. Ahrefs found 34.5% lower CTR across ~300,000 keywords (April 2025). Amsive measured -15.49% overall with branded terms gaining 18.68% (April 16, 2025). Seer Interactive tracked a 26% decline from January 2025 to February 2026 (April 24, 2026). Pew observed 8% versus 15% real-user click rates (July 22, 2025). The direction never flips.
What percentage of AI Overview citations come from top-10 organic rankings?
37.10% as of March 2, 2026, per Ahrefs' study of 863,000 keyword SERPs and 4 million AI Overview URLs, down from 76.10% in July 2025. BrightEdge, using its own methodology, puts the overlap near 17% (February 12, 2026). The exact level differs by study; the downward direction does not. Ranking still helps, but it no longer guarantees the citation.
Which sources do ChatGPT, Perplexity, and Google AI Overviews cite most?
They barely agree. In Profound's top-10 tables for August 2024 to June 2025, ChatGPT leans on Wikipedia (47.9% of its top-10 sources), Perplexity leans on Reddit (46.7%), and Google AI Overviews spread across Reddit (21.0%), YouTube (18.8%) and Quora (14.3%). Only 11% of domains are cited by both ChatGPT and Perplexity.
How many B2B buyers use AI tools during vendor research?
73%, per Loganix's multi-source analysis published April 3, 2026. The same release found only 22% of marketers track AI visibility, a 51-point gap that puts buyer adoption at roughly 3.3x the rate of marketer measurement. Forrester's survey of 4,000+ buyers, cited in the same release, found 61% of the buying journey completes before any vendor contact.
What predicts whether a page gets cited in an AI Overview: backlinks or brand mentions?
Brand mentions, on the available evidence. Ahrefs' correlation study (May 26, 2025) found branded web mentions at r=0.664 and branded anchor text at r=0.527, the strongest signals measured. The same page also lists backlinks at r=0.218 and Domain Rating at r=0.326, both far below branded mentions, which is the study's core finding.
Is llms.txt adoption actually growing in 2026?
The best current snapshot: 8.7% of the top 1,000 websites publish an llms.txt file (87 of 1,000 domains), rising to 15.8% among the 549 reachable sites in the sample (Rankability, June 23, 2026). That's a single point in time, not a trend line, so growth claims need a second measurement. You can check any domain's llms.txt file with our free tool.
Cite this page
Aktaş, F. (2026, October 6). AI SEO Statistics: Ranking Impact Studies. Mission Growth. https://missiongrowth.io/blog/ai-seo-statistics
Download the data: 1 table as CSV (CC BY 4.0)
Figures we made for this post are free to reuse under CC BY 4.0 with credit to Mission Growth.
Get Mission Growth highlighted in your Google results.