Skip to content
Mission Growth
  • Free Tools
  • About
  • Cases
  • Docs
Log in
  1. Home
  2. Blog
  3. AI SEO
  4. What AI Overviews Mean for Your SEO

What AI Overviews Mean for Your SEO

What AI Overviews means for SEO depends on query type: informational queries trigger 5x more than commercial, and citation beats ranking. Data, dated.

Analysis board comparing Ahrefs base-rate trigger data against Semrush composition-share data for AI Overviews, with CTR and query-intent panels

On this page

  • What AI Overviews Means for SEO Starts With How Often They Appear
  • Not All Query Types Are Affected Equally
  • Why the Numbers Don't Agree
  • AI Overviews Are Expanding Into Commercial and Transactional Queries
  • Which Industries See the Most AI Overview Coverage
  • What Happens to CTR and Traffic Once an AI Overview Triggers
  • The Headline Number
  • Cited Beats Uncited, and Both Trail "Ranked but Ignored"
  • The Counter-Intuitive Part: Zero-Click Doesn't Automatically Spike
  • What This Means for Content Strategy
  • What This Means for Budget and Prioritization
  • What This Means for Reporting
  • The Bottom Line
On this page
  • What AI Overviews Means for SEO Starts With How Often They Appear
  • Not All Query Types Are Affected Equally
  • Why the Numbers Don't Agree
  • AI Overviews Are Expanding Into Commercial and Transactional Queries
  • Which Industries See the Most AI Overview Coverage
  • What Happens to CTR and Traffic Once an AI Overview Triggers
  • The Headline Number
  • Cited Beats Uncited, and Both Trail "Ranked but Ignored"
  • The Counter-Intuitive Part: Zero-Click Doesn't Automatically Spike
  • What This Means for Content Strategy
  • What This Means for Budget and Prioritization
  • What This Means for Reporting
  • The Bottom Line

What AI Overviews means for SEO is not one flat number, and treating it as one leads to bad decisions. As of November 2025, about 15.69% of tracked Google queries triggered an AI Overview (Semrush, December 2025). That average hides the real finding: an informational query is roughly five times more likely to trigger an Overview than a commercial one (Ahrefs, November 2025), and whether your page gets cited inside the Overview changes your click outcome more than where it ranks does. The data below comes from Ahrefs, Semrush, Seer Interactive, and Loganix, each named with its date.

If you arrived here without the base vocabulary for AI search, start with our generative engine optimization guide. We write this blog with an answer-first, gap-analysis editorial process, running a SERP and AI-answer gap analysis before writing, which is why this post reconciles conflicting studies instead of repeating one uncontextualized figure. The AI Overviews SEO impact splits along query type, so the sections below segment it.

What AI Overviews Means for SEO Starts With How Often They Appear

The overall AI Overview trigger rate climbed from 6.49% of tracked queries in January 2025 to a peak of 24.61% in July 2025, then fell back to 15.69% by November 2025 (Semrush, "AI Overviews Study," December 15, 2025, based on more than 10 million keywords). That path matters because it is non-monotonic. Most competitor coverage frames AI Overview growth as a straight climb, and the data does not support that. Google expanded, pulled back, and re-tuned across the year, so any single "AI Overviews appear on X% of searches" headline is a snapshot, not a trajectory.

The absolute number also depends on which panel you trust. Trackers have reported figures from the low teens up toward 48% depending on the keyword set and date. For the full historical reconciliation of those 13% / 25% / 48% figures, see our AI SEO statistics reference, where each carries its own study and date.

One clarification before the query-type breakdown. AI Overviews are Google's inline summary block on the standard results page. AI Mode is a separate Google surface with its own trigger and citation behavior, covered in Google AI Mode. This post stays on AI Overviews.

What this means: stop reporting a single trigger rate to leadership as though it only rises. Report it as a range with a date, and expect it to move both ways.

Not All Query Types Are Affected Equally

The most useful question is not how often AI Overviews appear overall, but which queries trigger AI Overviews, and the data splits hard by intent.

Query intentTrigger rate (Ahrefs base-rate, Sept 2025)Share of triggered queries, Jan 2025 (Semrush)Share of triggered queries, Oct 2025 (Semrush)What changed
Informational21.4%91.3%57.1%Still triggers most often, but a shrinking share of the pool
Commercial4.3%8.15%18.57%More than doubled its share of triggered queries
Transactional2.1%1.98%13.94%Roughly sevenfold share growth, the fastest riser
Navigational0.9%0.84%10.33%From negligible to double digits

Two of those columns answer different questions, and a reader who conflates them will draw the wrong conclusion. That is the trap the next section walks through.

Why the Numbers Don't Agree

Search Google for AI Overview query intent data and you will find informational numbers that look like they contradict each other: 21.4% from Ahrefs, 57.1% from Semrush, and 38.7% from seo.com. All three are defensible, because the first two measure different things and the third comes with no methodology at all.

Ahrefs ran a base-rate study. Of all the queries in a given intent bucket, what share trigger an AI Overview. Its answer for informational is 21.4% ("What Triggers AI Overviews? 86 Factors and 146 Million SERPs Analyzed," Ryan Law and Xibeijia Guan, published November 10, 2025, drawn from 146,122,391 desktop SERPs in a September 2025 snapshot).

Semrush ran a composition study. Of all the queries that already show an AI Overview, what share fall into each intent bucket. Its answer for informational is 57.1% as of October 2025, down from 91.3% in January 2025 (the same December 2025 study, tracking more than 10 million keywords across the year).

Those are different denominators. Base rate asks how often an informational query triggers an Overview. Composition share asks, of the Overviews that fire, how many started as informational queries. Put concretely under one consistent measurement: Ahrefs' base rates say informational queries are still about five times more likely to trigger an Overview than commercial ones (21.4% divided by 4.3% is roughly 4.98). Semrush's composition data says informational's share of the triggered pool is falling fast. Both hold at the same time, because a category can dominate the base rate while losing share of a pool that is expanding underneath it.

Even one company's numbers drift between releases. A second Semrush page cites informational share falling from 89.03% (October 2024) to 57.16% (October 2025), close to but not identical to its 91.3%-to-57.1% figures, because the labeled months differ. The rule for anyone citing these studies: carry the methodology and the date, or you will publish a contradiction. The 38.7% from seo.com's 2.37M-keyword study arrives with no visible publish date or methodology on its page, so treat it as an undated third data point, not a precise measurement.

Grouped bar chart comparing each query intent’s share of AI Overview appearances in January 2025 versus October 2025, showing informational share shrinking and the other three intents growing.
Semrush composition study, December 2025, 10M+ keywords tracked across 2025.

AI Overviews Are Expanding Into Commercial and Transactional Queries

Here is the trend the base-rate snapshot hides. Using Semrush's composition data, one consistent methodology tracked across ten months, the combined share of commercial, transactional, and navigational queries among all AI-Overview-triggered searches went from 8.15 + 1.98 + 0.84 = 10.97% in January 2025 to 18.57 + 13.94 + 10.33 = 42.84% in October 2025. That is a 3.9x increase (42.84 divided by 10.97) in the monetizable share of AI Overview real estate, derived from Semrush's own monthly composition breakdown.

Transactional queries alone grew their share about sevenfold, from 1.98% to 13.94%. Informational search is still where Overviews show up most, but the direction of travel points straight at the queries closest to revenue.

What this means: the "AI Overviews only hit informational content" reassurance is a snapshot with an expiry date. If your program earns traffic on comparison, pricing, and buying-intent queries, plan for AI Overviews to reach them, because on this data they already are.

Line chart showing the combined share of commercial, transactional, and navigational queries among all AI-Overview-triggered searches climbing from about 11% to about 43% over 2025.
Semrush composition data, January to October 2025.

Which Industries See the Most AI Overview Coverage

Vertical sets your baseline before you touch a single page. Two independently run studies, on different dates and with different methods, agree at the extremes.

VerticalAhrefs exposure (Sept 2025)Semrush saturation (Nov 2025)
Science43.6%25.96%
Health43.0%not broken out separately
People & Society35.3%17.29%
Computers & Electronicsnot broken out separately17.92%
Real Estate5.8%under 3%
Shopping3.2%under 3%

The absolute numbers differ because the snapshot dates and panels differ. The ranking does not. Both studies put science at the top and both put shopping and real estate at the bottom. When two panels with different methods rank the same verticals highest and lowest, that agreement is worth more than either number on its own. Semrush also flags Food & Drink as its fastest-growing vertical, up 7.25 points since March 2025, which lines up with the commercial-expansion trend from the section above.

What this means: a health or science brand already operates in a 40%-plus AIO environment and should treat citation as core work today. A shopping or real-estate brand still keeps most of its clickable SERP, but the fastest-growing verticals show that runway shrinking.

What Happens to CTR and Traffic Once an AI Overview Triggers

The Headline Number

AI Overview presence correlates with a 34.5% lower average CTR across roughly 300,000 keywords (Ahrefs, April 2025). That is the most-quoted single figure in the category, and it is real, but a single figure is what this section argues against. For the full five-study CTR comparison, with Amsive, Seer, Pew, and BrightEdge side by side, see AI SEO statistics. The point here is what the average hides.

Cited Beats Uncited, and Both Trail "Ranked but Ignored"

Within queries that show an AI Overview, your position inside the Overview changes the AI Overview CTR you actually collect. Seer Interactive tracked 53 brands (5.47 million queries, 2.43 billion impressions). Brands cited directly inside the Overview saw CTR fall from 3.04% to 0.95%, a 69% drop. Brands ranking on the page but not cited fell from 1.65% to 0.55%, a 67% drop. The percentages look alike, but the starting points do not: cited pages delivered roughly 120% more clicks per impression than non-cited pages (Seer Interactive, April 24, 2026). Both still trail the no-Overview scenario by around 38%.

So does an AI Overview reduce traffic? On average yes, but the loss lands unevenly. Getting cited roughly doubles your clicks-per-impression versus ranking-but-ignored on the same AIO-present query. The whole world shifted down, and your position inside it still decides how much you keep.

The Counter-Intuitive Part: Zero-Click Doesn't Automatically Spike

The assumption baked into most "AI Overviews impact on SEO" coverage is that the moment an Overview starts showing for a keyword, that keyword's zero-click rate jumps. Semrush's transition-cohort data says otherwise. Among keywords that moved from no Overview to showing one, the zero-click rate went from 33.75% to 31.53%, a slight decrease, not the expected increase (Semrush, December 2025, cohort of more than 200,000 keywords).

One dataset is not the final word, and this does not make AI Overviews harmless. It means the mechanism is more specific than "Overview appears, clicks vanish": an Overview that fully answers a query suppresses the click, while one that opens a topic the searcher wants to pursue can still send them to a page.

What this means: measure CTR at the keyword and citation level, not as a portfolio average. A blended "our CTR is down X%" number tells leadership little, because that same average contains cited winners and uncited losers on the same queries.

What This Means for Content Strategy

The tactical playbook for earning a spot inside an Overview lives in how to show up in Google AI Overviews. The one data point that reframes strategy at the program level: the signals that correlate with AI Overview citation are not the signals that correlate with ranking. Ahrefs' correlation study found branded web mentions at r=0.664 and branded anchor text at r=0.527, the two strongest signals it measured, while backlinks came in far weaker at r=0.218 (Ahrefs, Louise Linehan and Xibeijia Guan, May 26, 2025).

Read plainly, a page can rank well on classic link signals and still get passed over for citation, because the model weights brand presence more heavily than your backlink profile. The content-strategy implication is to build brand footprint on purpose: mentions, consistent entity data, and presence in the sources AI engines already trust, layered on top of the on-page work that earns rankings. Publishing more posts does little on its own when the brand signals behind them stay thin.
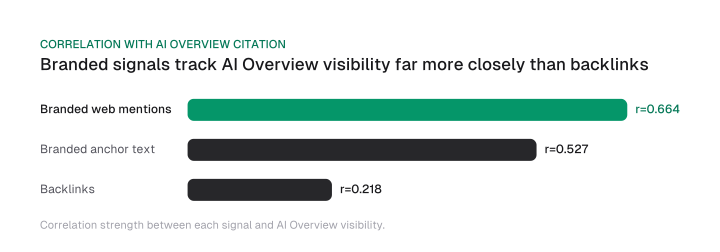
What this means: treat citation as its own objective with its own inputs, tracked apart from ranking, because optimizing for rank alone no longer guarantees the citation that now sits above it.

What This Means for Budget and Prioritization

The composition trend from earlier is a budget argument, not trivia. If the monetizable share of AI-Overview-triggered queries nearly quadrupled in ten months (the 3.9x figure derived from Semrush's composition data above), then the query types your pipeline depends on are the ones AI Overviews are reaching fastest. Waiting for the informational-only phase to settle spends down the exact runway you have left on commercial and transactional terms.

The urgency shows up in the adoption gap. 73% of B2B buyers now use AI tools during vendor research, while only 22% of marketers track AI visibility at all, a 51-point gap (Loganix, "2026 B2B AI Buying Behavior Analysis," April 3, 2026). Your buyers are already inside the AI answer. Most of your competitors are not yet measuring whether they appear there. For the fuller argument on whether the discipline survives this shift, read will AI replace SEO.

What this means: fund AI-visibility work on your money queries now, while measurement is still a differentiator rather than table stakes. This is a first-mover window that narrows as that 22% number climbs.

What This Means for Reporting

Reporting is where the Google AI Overviews SEO story gets uncomfortable, because the official data is thin. Google shipped a Generative AI performance report inside Search Console on June 3, 2026. Its first version shows impressions only: no clicks, no CTR, no average position, no query data, groupable by pages, countries, dates, and devices, with historical data starting May 18, 2026 and no backfill before that (Google Search Central, June 2026).

That has a direct consequence. Any team reporting a precise "AI Overviews cost us X% of clicks" number to leadership right now is working from an incomplete source, because Search Console does not yet expose AIO clicks or CTR separately, and its standard performance report bundles AI Overview clicks in with regular organic clicks. Tell stakeholders plainly: click-level AIO impact is estimated from third-party panels (Ahrefs, Seer, Semrush), not measured in your own Search Console, and the two will not reconcile perfectly.

This is the gap MissionGrowth's platform (disclosure: MissionGrowth is our product) is built to close: it tracks AI citations and visibility for customers, the citation-and-visibility layer that Search Console's impressions-only report does not yet provide. Before you can report on any of it, confirm your analytics are even capturing AI-referred sessions correctly, which our free tracker audit checks. For the wider measurement stack, our guide to AI search analytics maps what to track and where.

What this means: separate what you can measure (impressions, third-party CTR estimates) from what you can prove (your own click data), label each when you report it, and resist quoting one precise traffic-loss number you cannot source from your own instrumentation.

The Bottom Line

Three decisions follow. Report by query type, not a flat trigger or CTR number, because the blended average hides more than it shows. Move AI-visibility budget toward commercial and transactional queries while the monetizable share of Overviews expands and only 22% of marketers are watching. Track citation apart from ranking, with its own inputs. A practical first step: segment one month of your own CTR data by query intent, and the gap between your informational and commercial keywords will show where AI Overviews already cost you.

Frequently asked questions

Related

AI SEO

The AI SEO Optimization Checklist (35 Steps)

35 pass/fail checks in dependency order, technical readiness through measurement, each with a why and a literal test you can tick. Built to print.

Jul 8, 2026·13 min read
AI SEO

AI SEO Statistics: Ranking Impact Studies

Every AI SEO stat here carries a named source and date, checked against primaries. Includes the section no roundup has: the numbers others get wrong.

Jul 8, 2026·21 min read
AI SEO

AI SEO Trends 2026: 8 Shifts, Each With a Date

Eight AI SEO shifts from 2025-2026, every one anchored to a dated, named source: the citation collapse, Google's new report, and the crawler wars.

Jul 8, 2026·15 min read
Next step

Put these playbooks to work

Start with a free audit. See where the lift is before you commit.

How it works

  1. 01

    30-minute audit call

    We map your funnel against your goal and pull live data from your channels.

  2. 02

    Lift estimate

    You get a written estimate of where the lift is, with a 30-day plan to capture it.

  3. 03

    You decide

    Run it with us, run it in-house, or shelve it. No commitment from the audit.

Mission Growth

An always-on growth team. AI catches the signal, experts make the move, you see the result.

Unit 2A, 17/F, Glenealy Tower
1 Glenealy, Central, Hong Kong S.A.R.

Company

  • About
  • Case Studies
  • Free Tools
  • Docs
  • Blog

Legal

  • Privacy
  • Terms
  • Security
  • Cookies
  • DPA
  • Subprocessors
  • KVKK

© 2026 Mission Growth. All rights reserved.

Cookies

We use cookies to keep the site running. Read our policy.

Strictly necessary

Authentication and core platform. Always on.

Analytics

Anonymised product usage via PostHog. Form fields are masked.