Growth Experiment Cadence: The Rhythm That Compounds
A fixed growth experiment cadence beats occasional bursts. Size tests to your real traffic, and fold the monthly measurement review into the loop.
By Furkan AktaşPublished Updated

On this page
Growth experiment cadence is the fixed number of experiments you run per period, paired with a fixed review rhythm that closes each one out.
Sporadic bursts of testing don't compound the way steady cadence does; learning needs a schedule.
The part that decides everything else: sample size caps your cadence.
And the review that decides what to test next belongs inside the rhythm itself.
Key takeaways
- Cadence is two commitments: a fixed number of experiment starts each period, and a fixed rhythm for reviewing them.
- Traffic sets your ceiling. Match weekly test count and duration to your minimum detectable effect.
- Score the backlog with ICE or PIE, kill stale ideas monthly, and fold the measurement review into the same rhythm as the weekly readout.
What is growth experiment cadence?
Growth experiment cadence is two commitments held at once: how many experiments you start each period, and how often you review the ones already running.
Miss either half and you don't have a cadence. You have a habit that breaks during the first busy week.
Most conversion teams run experiments the way people go to the gym in January: a burst around a launch, then months of nothing. The quarterly sprint version looks tidier and fails the same way: a sprint that runs two weeks, followed by ten quiet weeks where nobody reads a result.
A cadence isn't a volume target either. "Run 20 tests a month" says nothing about whether any resolved. What matters is how many experiments start each period, paired with a fixed readout day, so every test has a birthday and a funeral on the calendar before it ships.
Why a fixed cadence beats occasional bursts
Steady cadence beats a single big bet because learning compounds and lone bets don't.
Compounding learning versus one big bet
Compounding learning beats a single big bet because most experiments lose.
Microsoft's 2017 research found that roughly a third of experiments improve the target metric, a third do nothing, and a third actively hurt it.
One winner from that same research, a Bing headline change, lifted revenue 12%.
A burst built around a single big test is one draw from that distribution, and the odds favor a loss or a flat line. Volume turns a low hit rate into a stream of compounding wins.
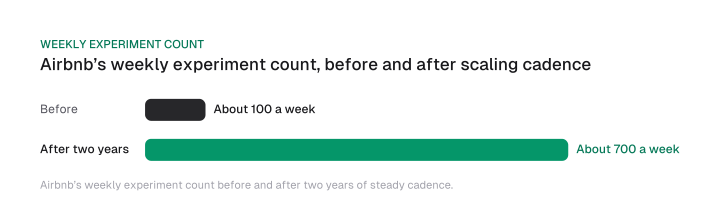
The teams that win publicly run a high, steady cadence of tests. Airbnb scaled from about 100 to 700 experiments a week over two years, and Booking.com runs roughly 25,000 tests a year with more than 1,000 live at once. Neither company got there in a sprint; they built the habit first and let the volume follow.
What breaks first when cadence slips
Cadence never collapses all at once; it erodes in a predictable order.
The readout day slips first, from Friday to whenever. Then the backlog stalls because nobody pulls from it on schedule. Then nobody closes the loop on last week's test, and the whole practice quietly stops.
The same slip kills any repeated measurement habit, which is why our walkthrough on tracking ChatGPT brand mentions ends by pointing here: steady cadence beats occasional bursts, and the logic is identical whether you're testing a landing page or logging AI mentions.
Setting the right experiment velocity for your traffic
Your cadence has a hard ceiling, and your traffic sets it.
Minimum detectable effect versus actual traffic
Minimum detectable effect, or MDE, sets the traffic your test needs: the smaller the effect you want to catch, the more traffic it takes.
The relationship is steep. Halving your MDE roughly quadruples the sample you need.
CXL's statistical-power primer sets the working target at about 80% power, an 80% chance of catching a real effect of the size you chose.
Run a test at roughly 40% of that required sample and power falls to around 50 to 55%, a coin flip.
An underpowered test still costs you: you ship or scrap based on noise and never learn whether the idea was any good.
The velocity times sample-size matrix
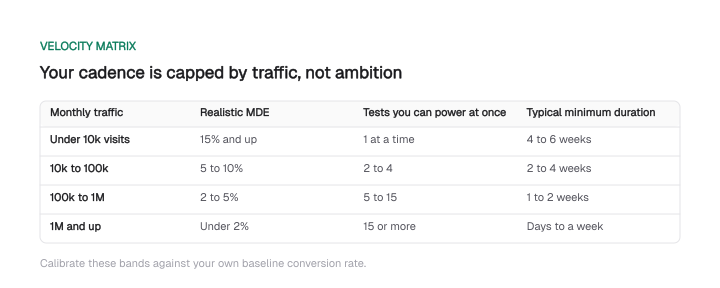
The relationship between MDE and traffic converts directly into a weekly test count.
Treat the bands below as a rule of thumb rather than a published benchmark. Calibrate them against your own baseline conversion rate.
Download CSV (CC BY 4.0)
Low-traffic teams: fewer longer tests win
Teams under 10,000 monthly visits should run fewer, longer tests.
High velocity is a trap at that volume. You can't power four tests a week, so running four just means learning nothing from any of them.
One test with enough power, run for six weeks, teaches you more than six shorter tests, each two weeks long, that all come back inconclusive. SEO runs on a slower clock: how long does SEO take to show results is a question of months, so judge it on leading signals instead of a six-week readout. For a young domain, a startup SEO strategy built for zero authority names the early signals worth reading.
Your cadence stays fixed, just slower: one honest test in flight, reviewed on the same rhythm, replaced the moment it reads out.
Prioritizing the backlog: ICE versus PIE
A fed backlog is what keeps a fixed cadence alive: every readout day opens a slot, and the highest-value idea should fill it.
Two scoring frameworks handle that job: ICE and PIE.
ICE (impact, confidence, ease)
ICE scores each backlog idea on three axes multiplied together: impact, confidence, and ease.
Sean Ellis, who coined the term growth hacking, formalized ICE in Hacking Growth, the 2017 book he wrote with Morgan Brown. The three axes:
- Impact. How much the idea moves the target metric if it works.
- Confidence. How sure you are it will.
- Ease. How cheap it is to build and run.
PIE (potential, importance, ease)
PIE swaps ICE's middle axis for importance: potential, importance, and ease, multiplied together.
Chris Goward introduced it in You Should Test That! (2012). The three axes:
- Potential. The improvement headroom on the page.
- Importance. Weights the traffic and value flowing through that page, so a small lift on your pricing page can outrank a big lift on a dead corner of the site.
- Ease. The same build-cost axis as ICE.
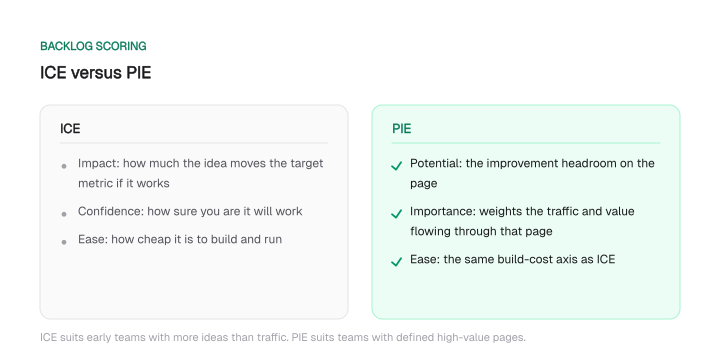
The two frameworks side by side:
The practical difference: ICE's confidence axis rewards ideas you believe in; PIE's importance axis rewards pages that matter to the business.
ICE suits early teams with more ideas than traffic. PIE suits teams with defined high-value pages and the traffic to test them.
Pick one and keep it. A score only works as a comparison across a backlog, and two scoring systems share no common scale.
Quantify the Impact or Potential axis where you can. If a test touches organic revenue, our SEO ROI calculator turns a projected ranking or conversion lift into a revenue figure you can score against, which beats a gut number.
Hypothesis-backlog hygiene
Backlog hygiene rests on two rules that keep it from rotting: a written hypothesis for every slot, and a fixed cycle for killing stale ideas:
- Require a written hypothesis. No slot opens without one: a sentence naming the change, its expected effect, and why. "Change the button color" fails that bar; "a higher-contrast primary button raises checkout starts because the current one fails our contrast check" clears it. If nobody can write the sentence, the idea isn't ready.
- Kill stale ideas on a fixed cycle. Anything unranked for a quarter is almost always dead. Review the tail of the backlog monthly and archive what nobody will defend.
The weekly and monthly ritual that keeps cadence alive
Cadence lives or dies on the calendar.
The weekly loop
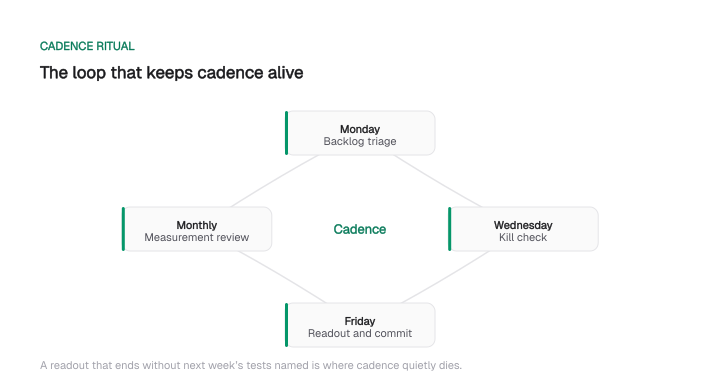
The weekly loop runs three fixed beats:
- Monday: backlog triage. Confirm each open slot has a ranked idea and a written hypothesis. If a slot is empty, pull the next-highest ICE or PIE score.
- Wednesday: kill check. Scan every running test for the obvious failures: broken instrumentation, a variant throwing errors, a test so underpowered it will never resolve. Kill those now instead of letting them waste the window.
- Friday: readout and commit. Thirty minutes. Each finished test gets a verdict: ship, iterate, or kill. Then, in the same meeting before anyone leaves, commit next week's slate. The commit-in-the-same-meeting rule is the whole trick: a readout that ends without the next tests named is where cadence quietly dies.
Here's the same loop as a quick reference:
Fold the monthly measurement review into the rhythm
A monthly measurement review decides whether the weekly tests point at the right thing.
The weekly loop runs the tests, but teams often treat the monthly review as a separate quarterly offsite and skip it. Fold it into the regular experiment rhythm instead, so the numbers drive the next slate rather than sitting in a tab.
Once a month, read results against a goal pyramid: process goals feed performance goals, which feed the outcome. The three layers:
- Outcome goals (top). Revenue, qualified leads.
- Performance goals (middle). Traffic, rankings, conversion rate.
- Process goals (base). Tests shipped, content published.
The review walks up the pyramid: did this month's shipped tests move the performance metrics? Did those move the outcome? Where the chain breaks, next quarter's hypotheses change.
Ground the top layer in a real number.
Our LTV:CAC calculator puts a value on the customers your experiments are meant to win, so the outcome layer is a figure the whole review agrees on.
For reviews that touch AI-search visibility, our guide to AI search analytics covers folding a monthly measurement review into that surface's rhythm, the same discipline applied to a different metric.
Avoiding false positives at high velocity
Velocity has a tax. The faster you test, the more false positives you manufacture, unless you plan for it.
Peeking and multiple comparisons
Two mechanisms drive false positives at high velocity: peeking and multiple comparisons.
Peeking is checking a running test early and often, then stopping the moment it looks significant. Every peek is another chance to catch random noise crossing the line.
A test monitored daily carries a real false-positive rate well above the 5% its p-value implies.
Multiple comparisons is the same problem across tests: run enough experiments and some look like winners by chance alone. GrowthBook and Statsig's documentation covers this peeking problem in depth.
The fixes are known: decide your sample size and duration before you start and hold to them, or use a sequential testing method built to be peeked at. Don't eyeball a p-value daily and call it the moment it dips.
Business, not science
But not every decision needs statistical proof. SearchPilot's 2025 principle, "SEO testing is business, not science," applies to growth broadly.
A low-risk, high-conviction change with no plausible downside can ship first and get measured after. You're making a business decision, and that bar is lower than a paper's.
Save the wait-for-significance discipline for genuinely uncertain, high-stakes calls where being wrong is expensive. Match the rigor to the risk; lab standards on a button-copy tweak waste the week.
Tooling for cadence
Cadence needs three tools, described by job rather than brand:
- An experimentation or feature-flagging platform to run variants, split traffic, and compute significance. This is where peeking protection and sample-size math should live, so your team isn't doing statistics in a spreadsheet.
- A hypothesis backlog tracker, which can be a simple database with fields for hypothesis, ICE or PIE score, status, and result. The point is one ranked list everyone works from.
- A shared dashboard the monthly review opens. One agreed view of the outcome, performance, and process layers, so the review argues about decisions instead of about whose numbers are right.
None of this has to be expensive. The discipline matters more than the stack: a team with a spreadsheet backlog and a fixed Friday readout out-learns a team with a premium platform and no rhythm.
How Mission Growth runs this as a continuous system
A weekly readout and a monthly measurement review are simple to describe and hard to sustain: they compete with every other fire a growth team fights.
The meeting is the first thing to slip when the week gets loud. Once it slips, the cadence unwinds.
We built Mission Growth, an AI-led SEO and GEO growth service, to hold the rhythm without depending on a meeting surviving a bad week.
AI catches the signal, our experts make the move, and you see the result: monitoring keeps the backlog fed and the readout stays on schedule even when your team is heads-down. Here's the split:
- What the platform automates: feeding the backlog, keeping the readout on schedule, and surfacing the weekly and monthly numbers.
- What stays human: writing the hypotheses and calling the results.
It removes the reason cadence usually breaks: a person having to gather the numbers by hand and force the meeting every week.
The compounding is real. Our work with Pozitif Teknoloji produced durable organic-search growth from exactly this kind of sustained, cadenced effort rather than a one-time push. See the Pozitif Teknoloji case study for what a steady rhythm returns over time.
Frequently asked questions
How many growth experiments should you run per week?
As many as your traffic can power, and not one more, anywhere from one test at a time on a low-traffic page to dozens at once on a high-traffic app. The ceiling is statistical. CXL's research on statistical power shows an underpowered test drifts toward a coin-flip read at around 40% of the required sample, so four weak tests teach you less than one properly sized one. Count backward from the sample each test needs, then set the number.
What is a good A/B test win rate?
Lower than most people expect, and that's normal. Across 2,288 tests over 71 engagements, a June 2026 agency analysis found 19.1% reached statistical significance, with a 50.5% raw win rate before significance filtering. Microsoft reports the same from the other side, from its own 2017 research: roughly a third of experiments improve the target metric, a third do nothing, and a third hurt it. A low experiment win rate argues for cadence, not against it: if four in five ideas fail to prove out, one big annual bet is very likely a loss, and only volume gives you enough winners to compound.
What is ICE prioritization?
ICE scores each experiment idea on three axes multiplied together: Impact (how far it moves the metric if it works), Confidence (how sure you are it will), and Ease (how cheap it is to run). Sean Ellis formalized it in Hacking Growth, the 2017 book he co-wrote with Morgan Brown. The score exists for comparability: rank the backlog, pull from the top each readout day.
ICE versus PIE: which should you use?
ICE (Impact, Confidence, Ease) and PIE (Potential, Importance, Ease) do the same job with a different middle axis. ICE's Confidence rewards ideas you believe in and suits early teams with more ideas than traffic. PIE's Importance rewards high-value pages and suits teams with defined money pages and the traffic to test them. Use one consistently; the choice matters less than never mixing two incompatible scales in one backlog.
How do you avoid false positives at high velocity?
Two rules. First, don't peek: set sample size and duration before the test starts and hold to them, or use a sequential method designed to be checked early, because monitoring a test daily and stopping on the first significant dip pushes the real false-positive rate well past the stated 5%, a mechanism GrowthBook and Statsig both document. Second, match rigor to risk. SearchPilot's 2025 principle applies here too: treat testing as business, not science, and reserve the wait-for-significance discipline for genuinely uncertain, high-stakes decisions.
How long should a growth experiment run before you call it?
Long enough to reach the sample your minimum detectable effect requires at about 80% power, which depends on your traffic and the effect size you're chasing. A smaller MDE needs a proportionally larger sample and a longer run, and CXL notes that power collapses toward a coin flip at roughly 40% of the required sample. Calculate the sample first, convert it to days at your traffic rate, then add full weekly cycles so weekday and weekend behavior both count. Anyone who quotes a universal "run every test for 14 days" is ignoring the math.
Cite this page
Aktaş, F. (2026, September 15). Growth Experiment Cadence: The Rhythm That Compounds. Mission Growth. https://missiongrowth.io/blog/growth-experiment-cadence
Download the data: 1 table as CSV (CC BY 4.0)
Figures we made for this post are free to reuse under CC BY 4.0 with credit to Mission Growth.
Get Mission Growth highlighted in your Google results.