Conversion Funnel Optimization: Which Stage to Fix First
Conversion funnel optimization usually means fix the biggest drop. Get the tie-breaker that adds revenue proximity, a worked example and a sourced ranking.
On this page
Your latest conversion funnel optimization review turns up three leaking stages. The standard advice is simple: find the biggest drop and fix it.
That advice breaks down the moment two stages lose a similar number of users, or a smaller percentage drop sits closer to the sale than a bigger one further back. A conversion funnel optimization strategy needs a second rule for that tie.
Userflow's own funnel guide already handles one tie with a ship-speed rule: fix whichever leak you can patch fastest. Glassbox goes further for individual errors inside one flow, weighing each one by its likely revenue impact.
Neither rule covers the case this guide adds: two whole stages, tied on users lost, one of them sitting closer to revenue.
This guide shows you how to optimize your conversion funnel with that second tie-breaker, a worked example built on a current benchmark, and a sourced, honestly bucketed ranking of which checkout-abandonment cause to fix first once you've picked the stage.
In this guide:
- What conversion funnel optimization means, and where the standard advice stops being useful
- How to map your funnel across the three vocabularies you'll meet in different tools and reports
- How to find the stage actually losing you the most people, ranked by raw numbers instead of percentage alone
- A decision rule for which stage to fix first, plus a sourced ranking of checkout-abandonment causes
- What counts as a good conversion rate, and how to keep measuring after the sale closes
What is conversion funnel optimization?
Conversion funnel optimization is the practice of improving how many people move from one stage of a multi-step funnel to the next, treated as one connected system rather than a list of pages to test separately.
A funnel is an ordered sequence: a visitor arrives, then moves through several defined stages toward a goal, each transition carrying its own conversion rate. Optimizing it means treating those transitions as one chain, not a set of pages you test in isolation.
A single leaking button or headline calls for a page-level A/B test: fix the element, measure the page. A leak between two stages, where no single page owns the drop, calls for rebuilding the transition itself, the handoff between stages rather than one page's copy.
This guide is for that second case: once you know several stages leak, which one earns your team's next sprint, and why that one over the others.
Mapping your funnel: stages, models and what counts as a conversion event
Mapping conversion funnel stages means naming each stage's entry and exit event, picking one stage model, and defining the conversion event that closes each stage before you measure anything.
Three vocabularies describe the same underlying sequence. TOFU/MOFU/BOFU splits it into three bands: top, middle and bottom of funnel. A five-stage marketing funnel spreads the same journey across awareness, interest, desire, action and loyalty. AARRR, the pirate-metrics framework, names its own checkpoints: acquisition, activation, retention, referral and revenue.
| Stage band | TOFU / MOFU / BOFU | Five-stage funnel | AARRR checkpoint |
|---|---|---|---|
| Awareness and first contact | Top of funnel | Awareness, interest | Acquisition |
| Evaluating the offer | Middle of funnel | Desire | Activation |
| Buying decision | Bottom of funnel | Action | Revenue |
| After the sale | Not covered | Loyalty | Retention, referral |
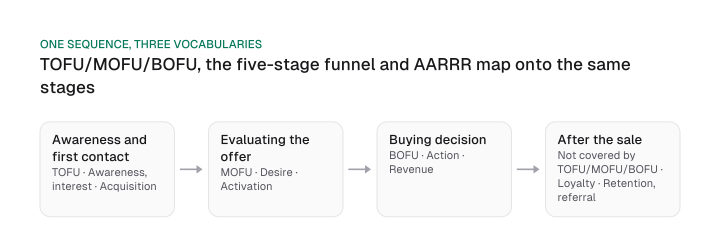
A conversion funnel chart is the visual form of that same mapping: one bar per stage, its width set by how many users reach it, narrowing top to bottom. The gap between two adjacent bars marks a drop-off worth investigating; check it against absolute users lost, since a smaller gap on a bigger bar can still cost more people than a bigger gap on a small one.
Whichever vocabulary your team uses, translate it once and stick to it. A report built on AARRR and a stakeholder asking about "top of funnel" numbers describe the same sequence.
Terminology gets confusing fast. "Sales funnel," "marketing funnel" and "conversion funnel" usually name the same sequence viewed by a different team. Marketing tracks the top, sales tracks the bottom, and product calls the whole chain by the third name. If you're deciding which content to build for which stage, matching search intent to funnel stage keeps a page from targeting the wrong part of the journey.
A stage model only holds while a buyer moves through it once, in order. When someone leaves and returns weeks later through a different channel, or skips straight to a later stage, the model breaks down. That's the signal to build a customer journey map instead of stretching a linear funnel to fit a path it was never built to describe.
A funnel model has one requirement before you can measure it: a defined conversion event that ends each stage. Not every click counts. Adding an item to a cart is a micro-conversion; completing checkout is the conversion event that closes that stage. Decide which events open and close each stage before calculating a single rate, or the numbers won't be comparable review to review.
Mapping stages also decides what you build next. Once you know which stage needs attention, saas seo build priority by funnel stage ranks the page types worth building for it, matched to the reader at that point in the journey.
Once that page exists, distribution matters too: content distribution matched to funnel stage decides which channel carries it and to which stage's audience, since a bottom-of-funnel page and a top-of-funnel post rarely share a distribution channel.
Finding the leakiest stage: read stage-to-stage rates, not one blended number
Finding the leakiest stage means computing every transition's own rate for one fixed cohort, because a single blended conversion rate hides which specific stage is losing people.
That's the essence of conversion funnel analysis: read each transition on its own instead of trusting the blended average.
A blended rate averages away the story: one number covering the whole funnel doesn't tell you whether the leak sits at signup, at checkout, or somewhere between. Compute each stage's own rate, for the same starting cohort, before deciding anything: visitors entering the stage minus visitors completing it, divided by visitors entering, as a percentage.
Segment that rate further, by channel, device or user role, before you treat a leaking stage as one problem. A checkout stage that leaks on mobile only needs a different fix than one leaking across every device.
Some funnel guides still cite an 88.05% cart abandonment rate from a March 2020 Statista snapshot, or 85% from Statista's third quarter of 2024 data.
Those are single-quarter snapshots, and they're already stale. Baymard Institute's September 2025 rolling meta-analysis of 50 studies puts the current average cart abandonment rate at 70.22%, and it moves as new studies land instead of freezing on one quarter.
That means roughly 29.78% of shoppers who reach checkout complete the purchase: the whole checkout cohort minus the 70.22% abandonment rate. Call it 30% for a working number you can check your own funnel against.
Here's why the same rate can still hide very different problems. Say your funnel looks like this, an example built on the real Baymard completion rate with two invented traffic segments feeding the same checkout stage:
| Segment (illustrative example) | Reaches checkout | Purchases (~30% completion) | Absolute checkout-stage loss |
|---|---|---|---|
| Segment A, say organic search | 1,760 | ~524 | 1,236 |
| Segment B, say paid social | 300 | ~89 | 211 |
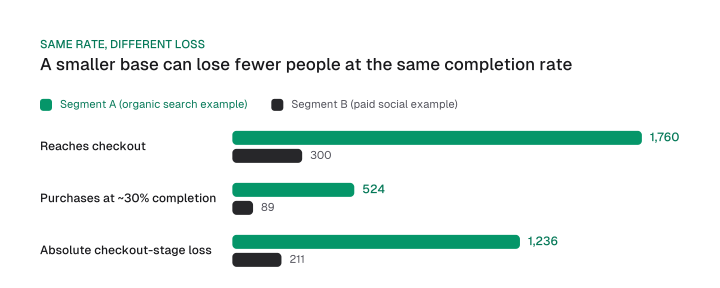
Both segments convert at the identical rate. Segment A still loses 1,236 people at checkout; Segment B loses 211. Judged on percentage alone, you'd rank them as tied. Ranked by actual people, they aren't close.
Rebuild this table with your own segment volumes before you trust a ranking built on it; the completion rate is real, the segment sizes are a labeled example.
Free tools carry their own trap here. GA4's default funnel reports blend every traffic source into one number unless you build a segmented funnel exploration. A segmented view is what surfaces a gap like the one above.
Which stage to fix first: a decision rule beyond "biggest percentage drop"
Fixing the right stage first starts with ranking stages by absolute users lost, then, when two stages are close, breaking the tie by downstream position: the stage closer to revenue costs more to leave broken, since its users already survived every upstream filter.
Deciding which funnel stage to fix first starts here: rank every leaking stage by absolute users lost instead of by percentage. The segment example above shows why: a smaller percentage drop on a bigger base can cost more real people than a bigger percentage drop on a small one.
Two published tie-breakers already exist for what happens next, when two stages lose a similar number of users. Userflow's own funnel guide picks whichever fix ships fastest.
Glassbox goes further, but only for individual errors inside one flow: it scores each error by frequency, users affected, criticality, potential revenue and the cost to fix it. That's an approach built for one bug at a time; it has no version for choosing between whole funnel stages.
Here's the rule this guide adds, combining both:
- Rank every leaking stage by absolute users lost, for a fixed cohort and a fixed window.
- When two stages sit within a similar range of users lost, default to Userflow's rule: fix whichever one ships fastest.
- Override that default toward the stage closer to revenue when its users have already survived enough upstream filtering to cost more to replace. A user who reached checkout already cleared awareness, consideration and cart; losing them costs more than losing a visitor who bounced on the landing page.
Once checkout is your target stage, not every abandonment cause is a page fix. Baymard's seven leading reasons non-browsing shoppers abandon a cart, out of eleven it discloses, split cleanly into two buckets.
| Reason shoppers abandon | Share | A checkout redesign fixes this? |
|---|---|---|
| Extra costs too high (shipping, tax, fees) | 40% | Yes |
| Delivery was too slow | 20% | No, it's a logistics decision |
| Didn't trust the site with card information | 19% | No, it's cumulative brand trust |
| Site wanted account creation | 18% | Yes |
| Too long or complicated checkout process | 17% | Yes |
| Couldn't see total cost up front | 12% | Yes |
| Not enough payment methods | 9% | Yes |
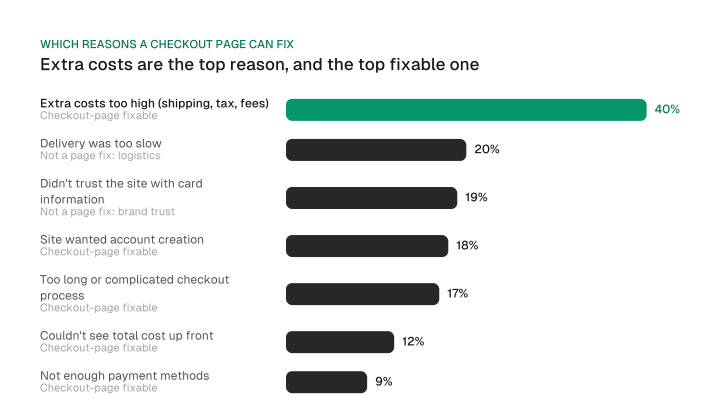
Five of those reasons are something a checkout redesign can fix directly: extra costs, forced account creation, a complicated process, hidden costs and too few payment methods. Two are not: delivery speed and payment trust, each ranking above forced account creation without being a page fix at all.
Extra costs stay the most-cited fixable reason by a wide margin, more than double the next fixable cause on the list.
Once you've picked the stage, you still need to rank the fixes inside it. That's a separate job: ICE versus PIE scores each test idea inside the chosen stage by impact and effort, once you already know which stage earns the work.
What's a good conversion rate for a funnel?
A good conversion rate for a funnel is one that beats your own trailing baseline, because a checkout stage converting notably below roughly 30% completion is confirmed behind the current market, while an industry-average table tells you nothing about your own funnel's shape.
Asking what is a good conversion rate for a funnel gets an unhelpful answer from industry-average tables, which vary by vertical, by traffic source and by whether a visitor arrived warm or cold. A single number pulled from one of those tables says little about your funnel specifically. Your own trailing baseline is the better yardstick: track your rate over time and treat any drop below it as the signal.
For your checkout stage specifically, you now have a number to check against. Roughly 30% completion, from the corrected Baymard figure above, is the current market baseline. A checkout stage running notably under that baseline is confirmed behind it, a stronger claim than "below average" on a table that was never built for your business.
Measuring the whole chain, on a cadence, without stopping at purchase
Measuring the whole chain means reviewing every stage's rate on a fixed cadence, watching one KPI per stage rather than a single blended metric, and treating the post-purchase stage as part of the chain instead of the funnel's finish line.
Pick one KPI per stage and review all of them on the same schedule, whether your funnel sells software or physical goods.
| Stage | One KPI to watch |
|---|---|
| Awareness / acquisition | Visits or sessions from the channel you're measuring |
| Consideration / activation | Rate into the next defined step: signup, demo request, cart add |
| Decision / revenue | Stage-to-stage completion rate: checkout, contract signature |
| Post-purchase | Repeat-purchase or referral rate in the following period |
Rebuild this table every review cycle instead of once a year. A quarterly cadence catches a seasonal dip before it compounds into three bad quarters.
A cadence alone won't catch a funnel that quietly stopped meaning anything. If no one owns the stage-to-stage numbers, or marketing and product define "signup" or "checkout complete" differently, the same report tells two different stories. Settle who owns each number and what it means before you rank stages by it.
Here's the gap: the funnel doesn't end at the purchase event, even though it's usually treated as the finish line. A repeat-purchase prompt or a referral ask sitting right after checkout is itself a measurable next stage. Track it the same way you track everything upstream of it.
Optimize that page like any other stage: give it one specific next action, a one-click reorder link or a referral prompt, and measure the rate it converts at.
Whether a given fix is worth the engineering time is its own question, answered per stage rather than once for the whole funnel. content roi tracked by funnel stage gives you the per-stage cost-tracking table for that decision.
For a straightforward revenue lift at one stage, we built and ship a free LTV:CAC calculator: run the projected lift through it to see whether the return clears the cost of shipping the fix.
The standard advice stops at "find your biggest drop." The harder decision comes next: when two stages tie, or a smaller percentage drop sits closer to revenue than a bigger one further back. Rank by users lost, default to ship speed on a tie, and override toward the stage nearer revenue when its users already survived the harder filters upstream.
Pull your own stage-to-stage numbers this week, rank them the way this guide does, and pick one stage before your next review cycle starts.
Frequently asked questions
Are conversion funnels, sales funnels and marketing funnels the same thing?
Usually, yes. "Sales funnel" and "marketing funnel" typically describe the same sequence of stages, viewed by a different team: marketing tracks the top, sales tracks the bottom, and "conversion funnel" names the whole chain end to end.
What is an eCommerce conversion funnel?
It's one named variation of the general funnel: a visitor moves from browsing to cart to checkout to purchase, ending at the sale instead of a signup or a demo request. The stages differ by business type; the sequencing logic in this guide applies to any of them.
What does conversion rate optimization (CRO) mean, and how is it different from funnel optimization?
CRO usually targets one page or one element on it: a headline, a button, a form. Funnel optimization is the system view this guide takes: which stage, out of several, deserves the next fix, and why that one first.
How does Google Analytics fit into funnel analysis?
GA4's Funnel Exploration and similar product-analytics tools measure stage-to-stage rates once you build a segmented funnel view. Treat it as one tool in the category rather than a substitute for deciding which stage to prioritize once you have the numbers.
Does the funnel end at the purchase page?
No. The post-purchase stage, including repeat-purchase prompts and referral asks, is part of the same measured chain and deserves its own stage-to-stage rate, the same as everything upstream of it.
Figures and images in this post are free to reuse under CC BY 4.0 with credit to Mission Growth.
Get Mission Growth highlighted in your Google results.