CRO Best Practices: Which CRO Tactics Actually Work
CRO best practices ranked by evidence: which tactics are proven, which are folklore, and a traffic-based rule for when to actually test one.
On this page
You've read a "CRO best practices" list before, probably more than one.
They all recommend the same eight or ten tactics: speed up your pages, shorten your forms, add urgency, test your button color.
What none of them tell you is which of those tactics have real data behind them and which are folklore: something that worked once, somewhere, and got repeated until it sounded like a rule.
This guide sorts the exact same tactics every CRO best practices list already covers into three evidence tiers, corrects two numbers a competitor states as fact, and gives you a rule for whether your own traffic can even produce a valid test before you spend a quarter running one.
In this guide:
- Which CRO tactics rest on large, dated data, and which don't
- Why the same case-study numbers keep getting repeated as proof
- Two stale stats corrected against current primary sources
- Why a famous Google anecdote doesn't apply to your site
- A traffic-based rule for when to ship, test, or skip a tactic
What "CRO best practices" actually means
Conversion rate optimization (CRO) is the structured practice of increasing the share of visitors who complete a target action: a purchase, a signup, a form submission. You calculate the rate by dividing conversions by total visitors and expressing the result as a percentage.
CRO matters in plain terms: it turns traffic you're already paying for into more revenue, without spending another dollar on acquisition. This guide works at the tactic level, sorting individual practices by evidence; mapping and fixing a full conversion funnel, stage by stage, is a different job with its own math.
Whether you search "CRO best practices" or the longer "conversion rate optimization best practices," you land on the same list. So does anyone who searches "what is CRO" first and works up to conversion optimization tips later. The tips repeat across every version: page speed, forms, CTAs, social proof, urgency, button color, personalization, retargeting.
What almost none of those lists do is tell you which tips rest on large, dated primary data and which rest on a single anecdote that happened to work once. A famous color test run at Google and a peer-reviewed Harvard Business Review study end up filed under the same bullet point, with the same weight.
That's the gap this guide closes. Every tactic below carries its evidence tier and its source, so you know what you're actually betting on before you spend engineering or design time on it.
The evidence-tier system: which CRO tactics are proven, mixed, or folklore
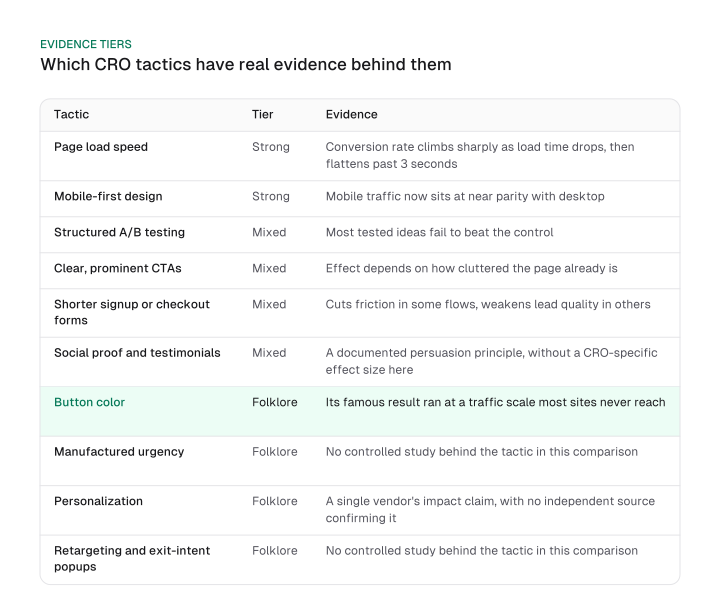
Common CRO tactics split into three evidence tiers that most published lists never separate: strong, mixed, and folklore.
Strong picks rest on large, dated primary data. The middle group helps in some setups and does nothing in others. Folklore rests on a single anecdote or an unverified vendor claim. The table below sorts real CRO examples into each tier instead of repeating a flat top-ten list.
| Tactic | Tier | Evidence | Source |
|---|---|---|---|
| Page load speed | Strong | Conversion rate climbs sharply as load time drops, then flattens past 3 seconds | Portent, April 2022 |
| Mobile-first design | Strong | Mobile traffic now sits at near parity with desktop | StatCounter, August 2026 |
| Structured A/B testing | Mixed | Most tested ideas fail to beat the control | Kohavi & Thomke, HBR |
| Clear, prominent CTAs | Mixed | Effect depends on how cluttered the page already is | Context-dependent |
| Shorter signup or checkout forms | Mixed | Cuts friction in some flows, weakens lead quality in others | Context-dependent |
| Social proof and testimonials | Mixed | A documented persuasion principle, without a CRO-specific effect size here | Cialdini |
| Button color | Folklore | Its famous result ran at a traffic scale most sites never reach | Bowman, 2009 |
| Manufactured urgency | Folklore | No controlled study behind the tactic in this guide | Uncorroborated |
| Personalization | Folklore | A single vendor's impact claim, with no independent source confirming it | Uncorroborated |
| Retargeting and exit-intent popups | Folklore | No controlled study behind the tactic in this guide | Uncorroborated |
Two of these tactics rest on real, dated data. Four sit in the middle, useful in some setups, weak in others. Four more are the loudest CRO strategies on every list and the thinnest on evidence.
For a SaaS site, the same tiers apply to the pages that carry your funnel: page load speed on the signup and trial pages sits in the strong tier, pricing-page CTAs and forms sit in the mixed tier, and a personalization pitch bolted onto onboarding stays folklore until a vendor discloses a control group.
B2B-specific traffic math for testing these gets its own depth elsewhere; this guide only sorts which tier each tactic belongs to.
Sorting a tactic into a tier is only half the process. Build a specific, testable hypothesis before you touch a variant: what you expect to change, and why. Start with one simple test variation instead of a full redesign.
Let data, heatmaps, session recordings, a direct conversation with users, point you at the blocker before you guess at a fix. The right tool in your stack tracks that data; it doesn't replace the hypothesis.
The next four sections walk through why each tier earns its label, starting with the pattern that inflates the folklore tier in the first place: an uncontrolled case study dressed up as proof.
Why the same case-study numbers keep getting repeated
A percentage lift reported with no stated control group belongs to a different evidence class than a controlled experiment, and the gap between the two can run into the thousands of percent.
Kohavi and Thomke's Harvard Business Review study documents exactly that gap: Yahoo's observational analysis of a brand-search campaign pointed to an 871% to 1,198% increase in searches, and the same idea tested as a controlled experiment produced a 5.4% effect.
That's the difference an undisclosed methodology hides, and mouseflow.com's own case studies show the pattern directly:
Derek Rose: a 37% lift, with no stated control group. Ecooking: a 10% lift, with no stated control group.
Either number could be real. Either could be inflated by seasonal traffic, a concurrent price change, or plain noise, and nothing in the case study lets you tell which.
The same mouseflow.com page also runs a case study for Rains that does disclose its methodology: a 9.8% cart-conversion lift and a 10.8% checkout-conversion lift, measured against a 90% probability threshold. One case study gives you something to verify. The other two ask you to take a number on faith.
No organic-ranked competitor in this guide runs a named case study at all; the genre lives on pages AI Overviews cite, not on the pages Google ranks directly.
The same methodology-versus-anecdote problem shows up outside CRO, too. AI SEO statistics studies disagree with each other for the same reason: different methodologies produce different numbers about the same claimed effect, and the reader has no way to reconcile them without reading past the headline figure.
The tactics with real evidence behind them
Page load speed and mobile-first execution carry the strongest evidence of any tactic in this guide, and one competitor's numbers for both are out of date.
aimers.io, ranking for this exact query, states:
"a site loading in 1 second achieves an average conversion rate of 39%, a number that drops to just 18% at the 6-second mark"
Portent's own April 2022 site-speed study, run across a full sample of 20 B2B and consumer sites, states a different set of figures: a blended, non-transactional goal conversion rate of roughly 40% at 1 second, 34% at 2 seconds, and 29% at 3 seconds, leveling off from there, then dropping to roughly half the 1-second rate at 5 seconds or slower.
Neither the 39% nor the 18% in aimers.io's claim matches Portent's current data.
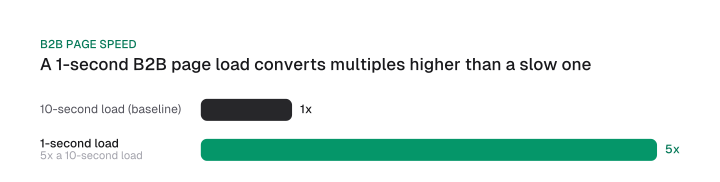
Portent's same study breaks out a second, B2B-only result from its 14-site B2B lead-generation sample, stated as a multiplier rather than a percentage: a 1-second load converts 3 times higher than a 5-second load, and 5 times higher than a 10-second load.
Mobile traffic shows the same stale-stat pattern. aimers.io claims:
"more than 61.5% of all web traffic comes from mobile devices"
StatCounter's own current numbers, from August 2026, put global mobile traffic at 49.36% and desktop at 49.11%, a near-even split, far short of aimers.io's claimed 61.5% mobile majority.
| Claim | aimers.io states | Current figure | Source |
|---|---|---|---|
| Page load, 1s vs. later | 39% at 1s, 18% at 6s | ~40% at 1s, 34% at 2s, 29% at 3s | Portent, April 2022 |
| Mobile share of traffic | 61.5%+ | Mobile 49.36%, desktop 49.11% | StatCounter, August 2026 |
Both corrections point the same direction: the underlying tactics are still strong, but the numbers used to sell them have drifted from the primary source they're supposedly quoting.
A few more tactics round out the mixed-evidence tier from the table above. Clear, prominent CTAs help most on a cluttered page and add little to one that's already clean. Shorter signup and checkout forms cut friction in some flows and weaken lead quality in others.
Social proof and testimonials rest on a documented persuasion principle, without a CRO-specific effect size backing the exact lift here. None of the three earns a strong-tier stat in this guide, so each is a candidate to test on your own traffic rather than a rule to ship blind.
The tactics to stop trusting blindly
Button color, manufactured urgency, an unverified personalization claim, and exit-intent popups sit in the folklore tier: each one's backing is a famous anecdote run at an outsized traffic scale, or a single vendor's number nobody else has confirmed.
The button-color anecdote is real, and it's the clearest example of why traffic scale matters. In 2009, Douglas Bowman, then a visual design lead at Google, wrote that a team at Google tested 41 shades of blue rather than settle a color decision on design judgment alone. That test happened, and it wasn't folklore: at Google's own scale, even a fractional-percentage difference in click behavior becomes statistically detectable.
Your site doesn't see that kind of traffic. A test needs enough visitors hitting each variation to separate a real effect from random noise, and the smaller the effect you're chasing, the more visitors that takes.
Google could detect a sliver of a percentage point because it had billions of chances to see it. Running the same test on a site with a few thousand monthly visitors would just produce noise dressed up as a result.
The anecdote's mechanism works like this: an effect only becomes visible once enough visitors have seen each variation to separate it from noise, and the required visitor count rises fast as the effect size shrinks.
Manufactured urgency (countdown timers, "only 2 left in stock"), personalization, and exit-intent popups fail the same evidence test for a simpler reason: no primary source in this guide backs a specific effect size for any of them. One personalization vendor, Optimizely, claims outsized lift from personalized experiences; no independent source confirms the number, which is exactly the pattern that keeps a tactic filed under folklore here.
None of these tactics are fabricated. The evidence behind them stops at a single event or a single vendor's word. Whether they're worth your time comes down to a question this guide hasn't answered yet: can your own traffic even produce a valid test.
Does your traffic even qualify you to test this?
A folklore- or mixed-tier tactic earns your time only when two conditions hold: your traffic can reach a valid result, and your expectations come from Kohavi and Thomke's documented base rate instead of a case-study sample stacked with wins.
Start with the traffic question. The smaller the effect you expect a tactic to produce, the more traffic it takes to tell that effect apart from noise.
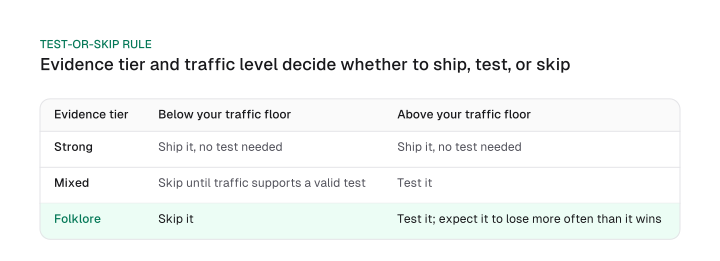
A strong-evidence tactic like page speed skips this test entirely: the primary data already supports it, so you ship it without running a controlled test first. A mixed- or folklore-tier tactic still needs one, and only your own traffic tells you whether that test will land on a real answer.
| Evidence tier | What to do |
|---|---|
| Strong | Ship it. The primary data already supports it. |
| Mixed | Test it once your traffic can reach a valid result; skip it below that. |
| Folklore | Skip it below your traffic floor. Above that floor, test it, and expect it to lose more often than it wins. |
You measure a CRO result the same way regardless of tier: track the one metric tied to the page's actual goal, run it for a pre-set window against a control group or the pre-change baseline, and only read the result once the evidence tier and traffic check above say the test could reach a valid answer.
Next, calibrate what "wins" actually looks like. Kohavi and Thomke's own data puts the real base rate at roughly 10% to 20% positive at Google and Bing, and roughly one-third positive, one-third neutral, one-third negative across Microsoft as a whole. A backlog built from published case studies looks nothing like that, because a losing test rarely becomes a case study.
Psychology has a name for that gap. Rosenthal named it the file drawer problem in 1979: studies with a positive, significant result get published far more often than studies that find nothing, which inflates how successful a practice looks from the outside.
The same logic applies to CRO case studies. The ones vendors publish are the wins, so the visible collection overstates how often any single tactic actually works. Calibrate your own odds against Kohavi and Thomke's documented base rate, and treat a vendor's folder of success stories as marketing rather than a representative sample.
This doesn't mean any individual case study is fake, only that the visible pile of them skews toward wins. A vendor that published its full test count, wins and losses together, would settle the question either way.
Once a tactic clears both checks, evidence tier and traffic, it's ready to enter your growth experiment cadence: the backlog that decides which cleared idea gets tested next.
Reading too little traffic as a real signal creates its own trap. The same small-sample-noise problem that misreads a random dip as a trend shows up in SEO forecasting too, just applied to search volume instead of a CRO test.
Frequently asked questions
What are the 7 principles of conversion?
No single, evidence-backed "7 principles of conversion" framework exists; this guide found none in wide use with a named body of research behind it. The question likely echoes Robert Cialdini's seven principles of persuasion (reciprocity, scarcity, authority, consistency, liking, social proof, and unity), which describe general influence rather than conversion specifically.
Why is A/B testing central to CRO best practices?
A/B testing is the only reliable way to tell a real effect from an inflated observational one. Kohavi and Thomke's Yahoo brand-search example shows why: an observational analysis suggested an 871% to 1,198% increase, while the controlled test of the same idea found a 5.4% increase.
Is 12% conversion rate on a website good?
No single number is "good" independent of page type, industry, and traffic source. A rate that looks strong on a low-intent landing page can look weak on a checkout page, and the reverse holds too. This guide doesn't add a new blended benchmark; check your rate against your own page type and traffic mix.
Is 2.5% a good conversion rate?
The same caveat applies here: a rate that's strong for a competitive, high-intent B2B category can be weak for a low-friction consumer purchase. Compare your own rate against your page type, funnel stage, and traffic source rather than a single blended industry figure.
Why does CRO advice on Reddit often disagree with published best-practices lists?
Most published CRO case studies don't disclose their methodology: no control group, no baseline, no test duration. Practitioners comparing notes get different results from the same "proven" tactic, and CRO best practices Reddit threads surface that disagreement directly, while published listicles usually smooth it over.
How do I choose a CRO partner?
Choosing a CRO consultant or agency isn't this guide's job: this page tiers tactics by evidence. Vetting who you hire, what it costs, and whether to build the skill in-house instead is a different decision, with its own checklist of questions to ask before you sign anything.
Most CRO best practices lists fail at the same step: they hand you the same eight or ten tactics without ever saying which ones are backed by evidence and which are folklore that happened to work once. Sorting your own backlog into strong, mixed, and folklore tiers, and checking each one against your own traffic before you test it, is the difference between running experiments and running rumors.
Pull up your current testing backlog and tag each item with its tier from the table above. Anything strong-tier ships. Anything folklore-tier waits until your traffic clears the bar to test it validly, and everything else gets tested with expectations set by a real base rate instead of someone else's highlight reel.
Figures and images in this post are free to reuse under CC BY 4.0 with credit to Mission Growth.
Get Mission Growth highlighted in your Google results.