SEO Forecasting: The Math, and Where It Breaks
SEO forecasting is only as good as its shakiest input. Rebuild the model with a verified AI Overview correction, a real volume check, and a validation step.

On this page
Run "seo forecasting" through two keyword tools and you get two different answers, on the exact phrase this guide targets. That's before you even open a forecasting model.
Every seo traffic forecasting guide opens with the same formula: keyword volume times a click-through curve, plotted forward. Almost none of them check whether the volume number is real, whether the curve still reflects Google's AI Overviews, or whether the shaded band around the line means anything.
This guide checks all three, on real data. It gives you the one distinction and the one validation step that turn the output into a number you can defend in a room.
In this guide:
- A real 31x gap between two volume tools, on this post's own target keyword
- Which of four forecasting methods fits your site, in a decision table
- A correction to a real competitor's AI Overview discount formula
- The revenue chain, in three honestly different scenarios
- How to read the shaded uncertainty band, and how to backtest your own model
What SEO forecasting actually is, and the word it keeps getting confused with
SEO forecasting is a structured estimate of future organic performance, built from data you already hold.
It stops being useful the moment its output, a range, gets reported as if it were the same thing as a target someone else set. A forecast and a target are two different numbers with two different owners.
A forecast is what your current effort and resources are on track to produce; a target is what the business wants. Confusing the two is why the gap between them gets discovered in a budget meeting instead of planned for.
Ahrefs' own worked example, published by Patrick Stox, sets this out plainly: "Say you project an uplift of 15% year over year (YoY) at the current effort and resource levels, but your target is 25%." Read that 10-point gap as the resourcing argument.
Here's the rule: when your forecast and your target disagree, you have three honest responses, never a fourth:
- Lower the target. State why the current plan can't reach it and what it can reach instead.
- Add resource. Show what budget or headcount closes the gap, and by when.
- Extend the timeline. Keep the target, move the date it's due.
What you don't do is quietly report the target as the forecast: that move turns a planning document into a promise nobody can keep.
Forecasting also has limits worth naming early. A brand-new site with no ranking history, or a one-off content push with no repeatable channel behind it, doesn't have enough data to forecast against yet. The honest move there is a wider band and a shorter timeframe, not a confident number; more on that in the accuracy section below.
A channel some assume is on its way out needs its baseline checked before you build a forecast on top of it, which is exactly the question is SEO dead because of AI answers.
The data inputs, and why your keyword-volume number might already be off by 30x
Every forecasting formula starts from a keyword-volume number, and that number is a vendor's estimate. It can disagree with another vendor's estimate by a wide, checkable margin.
Take this post's own target keyword. Our Semrush export lists "seo forecasting" at 4,400 monthly searches, KD 36, pulled in September 2026. Google Keyword Planner, pulled live on September 22, 2026, returns 140 monthly searches, LOW competition. Divide 4,400 by 140 and you get roughly 31x, two tools, the same keyword, the same month.
That gap comes from two different measurement methods, not from rounding error, and it produces two different starting points for the same forecast.
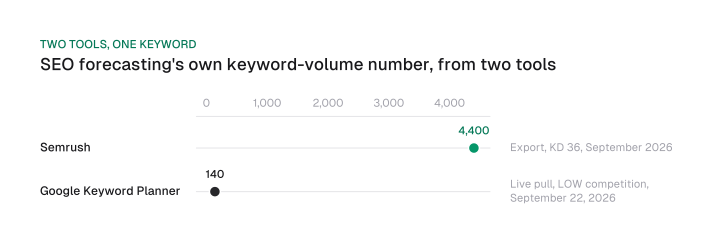
Check your volume source the way you'd check any other model input, before you build anything on top of it. The tool disagreement can be larger than the ranking-position assumption you're about to argue over in a meeting.
Third-party estimates like Semrush's are modeled from clickstream and ranking data across millions of keywords. Built to cover that many terms at once, they trade away precision on any single one.
First-party numbers, your own GSC impressions for queries you already rank on, and Google's own Keyword Planner for terms you don't, are slower to pull but harder to argue with. Use the vendor estimate to find candidates, then confirm the number with a first-party or Google-sourced source before you commit it to a forecast.
Four ways to build the model, and which one actually fits your situation
Four forecasting methods cover nearly every situation: keyword-based, statistical or historical, competitor-benchmark, and Prophet-class machine learning.
Which one is defensible depends on how much clean history you have and how new the site is, not on which method is most sophisticated.
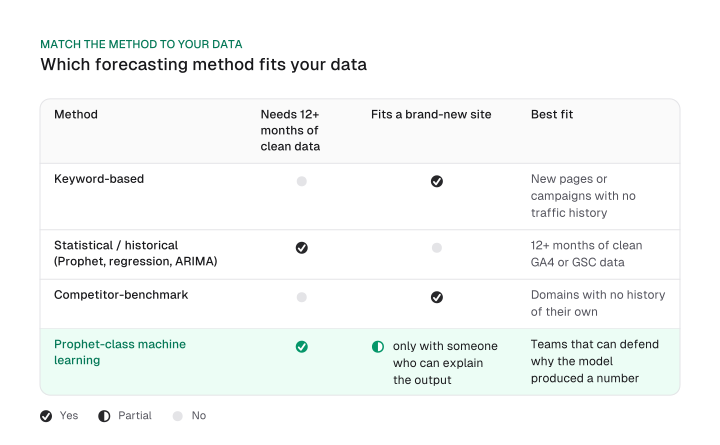
Keyword-based and competitor-benchmark methods both work with zero traffic history, which is why they fit new pages and new domains. Statistical and Prophet-class methods need 12 or more months of clean GA4 or GSC data behind them.
Prophet-class carries one more requirement the table can't show: someone on the team who can explain why the seo forecast model produced a given number, beyond reading the chart it drew.
That last requirement is worth a mechanism, because the statistical method is where most of the sophistication, and most of the false confidence, lives. Prophet, the open source forecasting library built by Meta's Core Data Science team, is an additive model: it fits a non-linear trend plus yearly, weekly and daily seasonality, plus holiday effects, on top of your historical series.
Here's the mechanism its own documentation states: by default, Prophet searches for its 25 potential trend changepoints only in the first 80% of your historical window (changepoint_range 0.8, changepoint_prior_scale 0.05).
So if something real shifted in the most recent fifth of your data, an algorithm update, a site migration, a big AI Overview rollout, the model won't register it as a trend change unless you widen that window or adjust the prior scale yourself. It keeps forecasting off the older trend instead.
Check that setting before you trust the line Prophet draws.
AI-assisted forecasting tools now sit inside most of the platforms above, generating the same four methods with less manual setup. They don't remove the judgment call in the table; they just automate the arithmetic once you've made it.
Your CTR curve is already out of date: building the AI Overview discount into the model
swydo.com's own published forecasting model applies one flat 0.4 multiplier to every keyword flagged as having an AI Overview.
It makes no distinction for whether your brand is cited inside that Overview or not, so the same constant overstates the damage on keywords where you're cited, and understates it on keywords where you're not.
Here's the formula it publishes, in a spreadsheet column that checks a yes/no flag and applies the same discount either way:
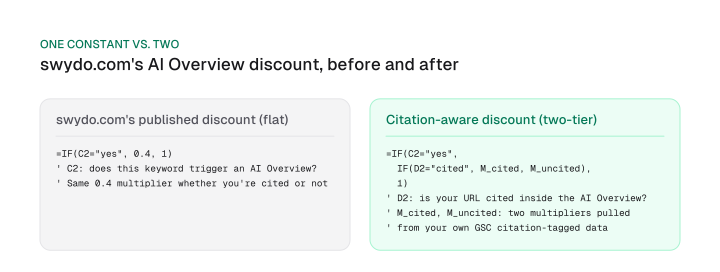
swydo's page even acknowledges the gap without closing it, telling readers to "tune the 0.4 to your own data" by hand.
The fix for ai overview seo forecasting is to stop tuning one constant and split the discount into two, built from your own Search Console data: filter clicks and impressions by whether your URL appears inside the AI Overview box for that query, then apply a lighter discount to the cited group and a heavier one to the uncited group.
That split is a modeling step, built from your own Search Console data rather than a new statistic. For the current AI Overview click-through numbers, AI Overview CTR walks through the dated figures; this section covers how to build the discount into your model.
From clicks to revenue, and keeping the forecast-vs-target gap honest
A traffic forecast turns into a business number only once you run it through a conversion rate and an average deal value.
That chain lands on a revenue range across three scenarios.
Here's a worked chain with clearly hypothetical numbers, the kind you'd swap for your own:
Conservative: 6,000 sessions x 1.2% conversion x $450 deal value = $32,400
Realistic:    8,000 sessions x 1.8% conversion x $500 deal value = $72,000
Ambitious:   10,000 sessions x 2.2% conversion x $600 deal value = $132,000
Notice all three inputs move together in each scenario: the conservative case pairs a lower traffic forecast with a lower conversion rate and a smaller average deal, and the ambitious case pairs a higher forecast with a higher conversion rate and a bigger deal.
Varying only the ranking-position assumption while holding conversion rate and deal value flat is how a single confident number gets presented instead of an honest range.
Once you have that range, the forecast-versus-target rule from the first section does the rest of the work. If the company's revenue target sits above your ambitious case, treat the gap as the resourcing argument, made with a number instead of a feeling.
SEO ROI covers how to measure what a channel actually returned once the traffic showed up, a different question from projecting it here. We built and ship a free SEO ROI calculator for running your own numbers through this chain; it calculates return on the inputs you give it, and it doesn't project future traffic on its own.
How accurate is this, really: reading the uncertainty band and validating the model
A forecast's shaded uncertainty band isn't a guarantee. Ahrefs' own forecast graphs use an 80% probability interval.
That interval means roughly one in five times, the real number should land outside the shaded range instead of inside it.
That's worth sitting with. An 80% band that gets beaten one time in five isn't broken; it's doing exactly what an 80% band is supposed to do. Treat a single miss as proof the model failed and you'll throw out models that are working fine.
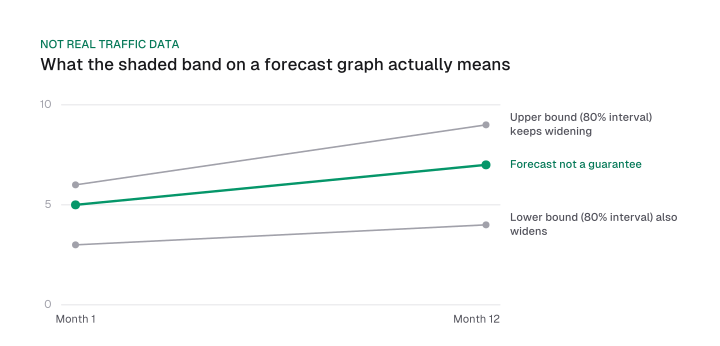
The illustration above is a hypothetical forecast, not real traffic data:
Month 1:  forecast 1,050 | 80% band 900 to 1,200
Month 12: forecast 1,650 | 80% band 1,400 to 1,900
Validate seo forecasting accuracy with a backtest against a real held-out period, not the shape of the shaded band: hide your most recent weeks, forecast them, then check how far off the model landed, the same changepoint mechanism from the last section in reverse.
Daniel Heredia's writeup for OncrawL is a real example of the method. Backtesting a Prophet forecast on his own site by holding out the last 12 days of data, he got a mean absolute error of 13, meaning the model's forecast was off by 13 sessions per day on average.
That's one practitioner's own result on his own traffic pattern. Run the same backtest on your own held-out period and use your own number instead of his.
Common mistakes that break a forecast
A few habits break a forecast before it gets that far:
- Unfiltered branded search. Mixing branded and non-branded terms in the same volume pull inflates the baseline the model learns from.
- A skipped changepoint check. Running the model again after a known site change without checking the window from the last section.
- A too-short rolling window. Re-running the model on a window so short that ordinary month-to-month noise gets read as a trend.
Brand-new sites and seasonal swings
A brand-new site with no ranking history to backtest against yet needs the same honesty, with a wider band.
Competitor-benchmarking is the defensible starting method here, and how long does SEO take covers the timeline expectations that go with it.
A seasonal or industry-wide swing needs its own adjustment too. Prophet's built-in yearly and weekly seasonality, the same mechanism from the last section, already absorbs a lot of this; on top of it, compare a seasonal term year over year instead of month over month, so a normal seasonal dip doesn't get read as the same kind of shift a real changepoint would produce.
How often to re-forecast, and what changes for local vs. national
A forecast built on a small local search-volume number needs a wider error bar, not a tighter one, because small numbers swing harder month to month than large ones.
This post's own volume pull makes the point without a new example. Google Keyword Planner shows "seo forecasting," a 140-monthly-search term, swinging -92.9% over three months.
That's small-sample noise on a low-volume term, not a real collapse in interest; a 140-per-month baseline can drop by that percentage on a handful of fewer searches. A local campaign built on a similarly small volume number will show the same swings for the same reason: don't read them as a trend.
Re-run a forecast on a fixed cadence tied to your baseline window, not on a hunch that something changed. Quarterly is a reasonable default for most accounts; re-run sooner after a known event (a migration, a core update, a new AI Overview rollout in your category). Treat a small campaign's volume swings as noise to plan around, never as a signal to chase.
Templates and tools, without the sales pitch
A free seo forecasting template or a paid tool only replaces the arithmetic in this guide, not the judgment behind which method and which discount to apply.
A seo forecasting template turns this post's own inputs into columns you fill in once and reuse. At minimum it needs:
- Keyword and volume source. The term, its vendor-reported volume, and a column for the first-party or Google-sourced check from the second section, so the two numbers never sit unchecked side by side.
- Method and discount tier. Which of the four methods from the decision table applies to that keyword, plus its AI Overview citation tier and the two-tier discount for any keyword an Overview shows on.
- Forecasted sessions, conversion rate, and deal value. One row per scenario, the same three columns the revenue chain uses, so conservative, realistic and ambitious never share a row.
- Confidence band and backtest error. The upper and lower bound the model outputs, plus the mean absolute error from your last backtest, so the number carries its own error bar into the room.
Spreadsheet templates handle the keyword-based and competitor-benchmark methods well; they're built for a formula you can see and audit. Dedicated seo forecasting tools and the forecasting modules built into rank trackers add the statistical and Prophet-class methods from the decision table above, at the cost of a black-box model you have to trust without seeing the changepoint settings underneath it.
Pick a template or tool by which method from that table it actually implements. Once you have a number, SEO dashboard covers where a forecast belongs in an ongoing report, alongside the actuals it gets checked against.
None of that replaces checking your own three inputs first: the volume number, the AI Overview discount, and the backtest that proves your band is honest. Pull your own Keyword Planner number for your own target keyword before you build anything else on top of it.
Frequently asked questions
No. A forecast is what your current effort and resources are on track to produce; a target is what the business wants. Ahrefs' own published example shows a 15% projected uplift against a 25% target; that gap is the resourcing argument.
Long enough to cover a real backtest period and short enough that a changepoint check still catches recent shifts, typically a quarter to two quarters. Validate any timeframe against your own backtest error before presenting it, rather than picking a round number.
Less accurate than for a site with history, and that's expected: with no data to backtest against, competitor-benchmarking is the honest starting method, run with a wider uncertainty band than an 80% interval built on 12 months of clean data would need.
On a fixed cadence tied to your baseline window, quarterly by default, and sooner after a known event like a migration or a core update. A rolling window that's too short turns ordinary noise into a false trend.
Figures and images in this post are free to reuse under CC BY 4.0 with credit to Mission Growth.
Get Mission Growth highlighted in your Google results.