Growth Experiments: Examples, 3 Test Types, 1 Template
Growth experiments explained: what counts as one, a funnel-stage example table, three test types including the fake-door test, and a one-page brief template.

On this page
You've read at least one "growth experiments" listicle already. You know the words hypothesis and A/B test. What you probably don't have yet is a repeatable way to decide what to test, write it up, and check whether the result you got is real.
A growth experiment ties a single hypothesis to one growth metric, then tests whether the prediction holds. Every ranking guide on the topic agrees on that much. What's missing from most of them is a menu of growth experiment ideas that spans the whole funnel instead of one stage, a third test type the field rarely names, and a template you can fill in without leaving the page.
In this guide:
- A definition of a growth experiment, plus a firsthand example of a $60 million test result
- A table of growth experiment examples across all five funnel stages
- The three practical test types, including the fake-door test
- A growth experiment brief template that fits on one page, filled in
- Twyman's Law, and the one check that keeps a dramatic result honest
What is a growth experiment?
A growth experiment validates or invalidates one specific assumption about a growth metric through a structured, testable hypothesis. It's informed by data, tied to one metric you're trying to move, and most teams score their backlog with ICE before running anything (more on that scoring step later).
An A/B test is one method used inside a growth experiment, alongside a multivariate test and a fake-door test. Treating every test as "an A/B test" hides which method you actually ran.
You don't need a dedicated growth team to start one. HubSpot's own guidance backs a simple rule here: run growth experiments inside an existing marketing, product or lifecycle team, with one named owner and a shared, ranked backlog. A dedicated team is a scaling decision you make once you have enough experiments running that coordinating them becomes someone's whole job.
Here's what that intuition problem looks like in a real, dated case.
Dan Siroker ran this test as analytics director for Barack Obama's 2008 presidential campaign, and told the story firsthand on Optimizely's blog. The splash page combination the campaign staff favored going in lost to a different combination once it was tested: the winner posted an 11.6% sign-up rate against 8.26% for the staff's own pick.
Siroker's own extrapolation across the full campaign put that gap at roughly 2.88 million additional email signups (about 10 million actual signups against an estimated 7,120,000 without the winning version) and 288,000 more volunteers. At the campaign's average of $21 for each email address that signed up, he estimated about $60 million in additional donations, a figure that's his own extrapolation rather than an audited number.
The campaign's own experts had already picked the losing combination before the test ran. That's exactly what a structured test catches and intuition alone misses.
Growth experiment examples, by funnel stage
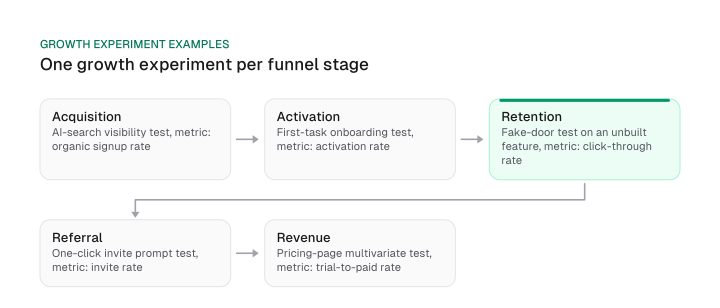
Growth experiments exist for every stage of the funnel: acquisition, activation, retention, referral and revenue, each with its own bottleneck and its own test. The table below names one hypothesis and the one metric it moves for every stage, in a single reference you can scan top to bottom.
| Funnel stage | Example growth experiment | Metric it moves |
|---|---|---|
| Acquisition | Test whether adding an AI-search visibility signal to a landing page's above-the-fold copy increases organic signups | Organic signup rate |
| Activation | Test whether an onboarding checklist that opens with a first real task, instead of a teammate invite, gets more new users to their first meaningful action | Activation rate |
| Retention | Run a fake-door test on a feature that isn't built yet, an export button that captures clicks, to see whether the users asking for it would actually use it | Click-through rate as a demand signal |
| Referral | Test whether a one-click invite prompt placed right after a user's first successful action increases the share of accounts that send an invite | Invite rate |
| Revenue | Run a multivariate test on the pricing page, changing the highlighted tier and the trial-length copy together, to see which combination moves more visitors to a paid plan | Trial-to-paid conversion rate |
The acquisition-stage test above matters because more buyers discover brands through AI answers now, and AI search visibility KPIs make that shift measurable, which is why a test like this produces a signal in the first place. Mission Growth's platform tracks AI citations and visibility for customers.
That signal takes time to build up: see how long does SEO take to show results for the timeline to expect before you read a conclusion from it.
The retention-stage row above is a fake-door test, the third type covered next. It measures whether people want a feature before anyone builds it.
Three types of growth experiments
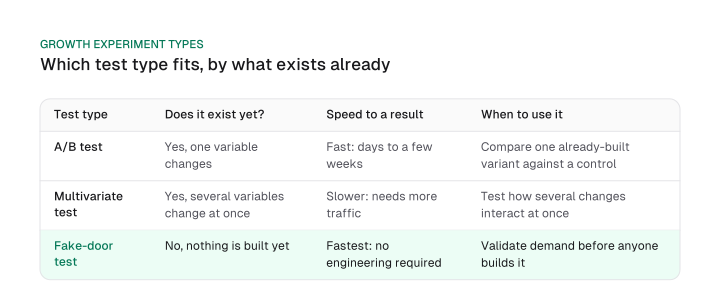
Practical types of growth experiments split into three: an A/B test, a multivariate test and a fake-door test, and which one fits depends on whether the thing being tested exists yet.
| Test type | Does it exist yet? | Speed to a result | When to use it |
|---|---|---|---|
| A/B test | Yes, one variable changes | Fast: days to a few weeks, depending on traffic | Compare one already-built variant against a control |
| Multivariate test | Yes, several variables change at once | Slower: needs more traffic to isolate each combination | Test how several changes interact instead of testing them one at a time |
| Fake-door test | No, nothing is built yet | Fastest: no engineering required before you read demand | Validate demand for a feature, tier or flow before anyone builds it |
An A/B test compares one changed variable against a control. A multivariate test compares several changed elements in the same test, at the cost of needing more traffic to isolate which combination actually moved the metric.
The fake-door test is the one worth learning first, because it's the one to reach for before you write a line of code. Ship only the entry point, a pricing tier on a pricing page, a signup button for a feature that doesn't exist yet, and count who clicks it.
A high click-through rate tells you demand exists before you've spent any engineering time building the thing itself. A low one saves you from building it at all.
A framework to design and prioritize your experiment
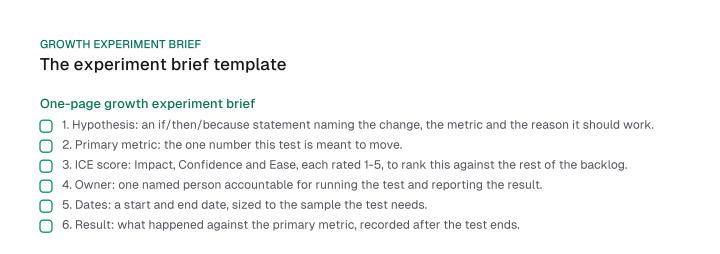
A growth experiment framework starts with an if/then/because hypothesis, gets scored against the backlog with ICE, and ships with its fields recorded on one page before it runs.
Here's the framework in three steps:
- Write the hypothesis as if/then/because: what changes, what should happen, and why.
- Score it against the rest of your backlog with ICE: Impact, Confidence and Ease, each rated 1-5.
- Record it on one page before it runs, so anyone can see what's being tested and why.
Here's the same fields filled in for one hypothesis:
| Field | What goes in it |
|---|---|
| Hypothesis | If we cut the signup form from two fields to one, then completion rate rises, because fewer fields reduce drop-off |
| Primary metric | Signup completion rate |
| ICE score | Impact 4, Confidence 3, Ease 4 |
| Owner | One named person accountable for running the test and reporting back |
| Dates | A start and end date, sized to the sample the test needs |
| Result | What happened against the primary metric, recorded and shared so the next backlog decision can use it |
ICE ranks every backlog item on the same shared scale, Impact and Confidence and Ease from 1 to 5, so a fake-door test for an unbuilt feature can sit against a straightforward A/B test on a signup form.
RICE is a related method. It keeps Impact and Confidence but scores Reach and Effort as their own separate factors; picking between them matters less than picking one and using it consistently.
Scoring tells you what to run next. It doesn't tell you how many to run at once, which is a question of your traffic and your team's capacity, covered in growth experiment cadence.
How to read a growth experiment's result honestly
A growth experiment's result deserves the same scrutiny whether it wins or loses, and Twyman's Law says the too-good-to-be-true win is the one most likely to be a bug.
Ron Kohavi and Roger Longbotham of Microsoft's Experimentation Platform team cited Twyman's Law and backed it with a catalogue of real cases in a December 2010 paper: dramatic "wins" that turned out to be browser-redirect failures inside an A/A test, or exposure-control errors that silently dropped users from one arm of the test.
The action this gives you: before you ship a result that looks unusually good, run it back as an A/A test or check your instrumentation the same way you'd check a losing result. A dull, expected win earns less suspicion than a result nobody predicted.
The same scrutiny applies wherever a number jumps overnight, including a content ROI figure that suddenly doubles. Check the tracking before you believe the win.
Sizing a test before you trust its result and diagnosing a split that looks broken are their own subjects. Minimum detectable effect, sequential testing and sample ratio mismatch each get the full statistical treatment elsewhere. For which tools to track your results in, see tooling for cadence.
Growth experimentation only works when one hypothesis is tied to one metric, scored against a backlog, and recorded before it runs. What turns that into results is a menu that spans every funnel stage, a fake-door test for validating demand before you build anything, a growth experiment template you actually fill in, and Twyman's Law as your check against a result that looks too good.
Pick the funnel stage where you have a real bottleneck, write its hypothesis on the template above, score it against the rest of your backlog, and run it before you add another item to the list.
Frequently asked questions
Do we need a dedicated growth team to start?
A dedicated growth team isn't required to start. Run growth experiments inside an existing marketing, product or lifecycle team, with one named owner and a shared, ranked backlog; a dedicated team becomes a scaling decision once coordinating your experiments turns into someone's whole job.
How is a growth experiment different from routine CRO testing?
A growth experiment can test acquisition, retention or pricing changes, while routine CRO testing usually stays on one page's conversion elements: a CTA, a form or a piece of social proof. For the evidence-tiered breakdown of those page-level tactics, Mission Growth's CRO tactics guide covers that ground directly.
How long should a growth experiment run before I read the result?
Run a growth experiment until it reaches the sample size it was sized for. A calendar deadline is the wrong stopping signal because it ignores how much traffic the test actually needs. Minimum detectable effect sets that sample size before you start, and sequential testing covers the cases where checking early is genuinely valid.
What's the difference between ICE and RICE scoring?
ICE scores a backlog on three factors, Impact, Confidence and Ease, on a shared 1-5 scale. RICE keeps Impact and Confidence but scores Reach and Effort as their own separate factors, which changes how backlog items rank against each other.
Figures and images in this post are free to reuse under CC BY 4.0 with credit to Mission Growth.
Get Mission Growth highlighted in your Google results.