Incrementality Testing: How to Run a Test and Read iROAS
Incrementality testing shows which marketing actually caused sales. Learn the test designs, how to size and run one, and read lift and iROAS correctly.
On this page
Your dashboard says a campaign is driving a healthy share of last month's conversions. Pull the spend, and only some of those conversions actually disappear. The rest show up anyway, from people who were already going to convert.
Incrementality testing is the only way to find that real number. It holds marketing back from a control group and measures what changes, instead of trusting an attribution model to guess.
The part that decides whether that number is trustworthy at all: the test design you pick, and a blind spot specific to the conversion lift studies platforms run for you.
In this guide:
- The four test designs and which one fits your channel
- How to size and run a test without the classic mistakes
- How to calculate lift, iCPA and iROAS from one worked example
- How to read a positive, negative or inconclusive result
- The failure modes that break a test before results ever come in
What incrementality testing actually measures
Incrementality testing isolates the sales, signups or conversions a marketing activity actually caused from the baseline that would have happened anyway, using a real control group instead of a model.
Uber ran exactly this test on its own Meta ad spend, and used the result to cut a real budget line. A three-month incrementality test found that Meta ads weren't producing incremental new user acquisition in the U.S.: the same new users showed up whether or not those ads ran. Uber paused that spend, and annual savings landed at roughly $30 million in the U.S. market alone.
That $30 million figure is the only sourced number behind this story. Several guides repeat a higher figure with no source at all; this one comes from Humans of MarTech's own recap of the episode, published in January 2025, summarizing what Uber's Sundar Swaminathan said on the podcast rather than quoting him directly.
Platform dashboards report attributed conversions: everyone who saw an ad and later converted gets credited to it. Attribution models overstate a channel's real causal effect because they credit conversions that would have happened without the ad, including people who were already searching for the product. Only a controlled experiment separates the two numbers.
Attribution got less reliable for another reason: Apple's App Tracking Transparency took effect with iOS 14.5 on 2021-04-26, over five years before this guide, though several still-live guides describe it as an upcoming change rather than the current baseline every iOS campaign already works under.
The incrementality testing vs a/b testing question comes up constantly, and the difference is worth stating plainly:
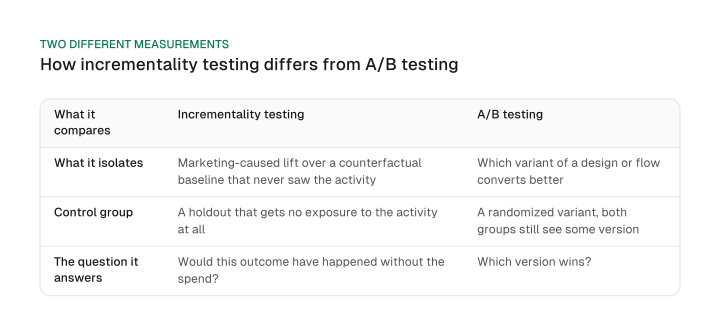
Incrementality testing isolates marketing-caused lift over a counterfactual baseline that never saw the activity. Its control group is a holdout that gets no exposure to the activity at all, so the question it answers is whether this outcome would have happened without the spend.
A/B testing isolates which variant of a design or flow converts better. Its control group is a randomized variant, and both groups still see some version, so the question it answers is simply which version wins. Attributed performance and incremental performance are different numbers, and only a controlled experiment produces the second one.
The same causal gap shows up wherever a team tries to prove a channel's contribution to revenue. Content teams run into it trying to prove content ROI; paid teams run into it every time a platform's attributed number and a holdout's real number disagree. For how incrementality testing, marketing mix modeling and attribution work together as a full measurement stack, see Mission Growth's MMM vs. MTA breakdown.
The four test designs, and which one fits
Incrementality tests come in four working designs: audience holdout, geo lift, platform conversion lift, and ghost ads or PSA holdout. What you can control decides the right one.
Three questions settle it:
- Can you target individuals directly? Email lists, push audiences and addressable digital ads support an audience holdout. Billboards, TV and in-store promotions don't, so retail and QSR brands lean on geo lift instead.
- Is the platform already running the test for you? Meta and Google both offer a built-in conversion lift test. It's free and fast to set up, but it carries the limit explained below.
- Can you afford to spend budget on a placebo? A ghost ads or PSA holdout isolates the cleanest signal, at the cost of real spend or effort that converts into nothing.
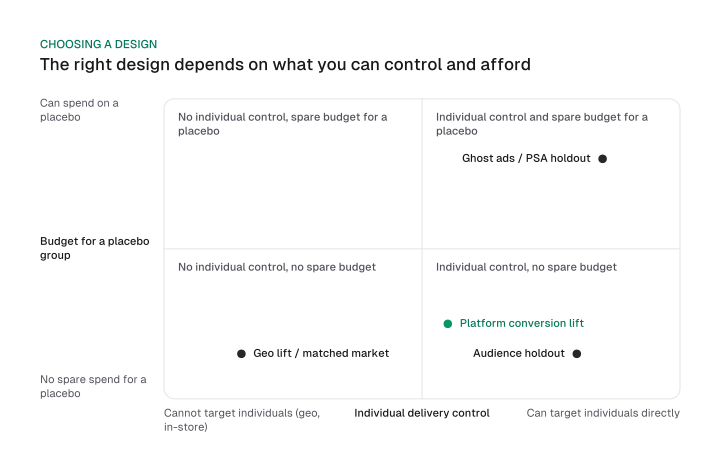
The two axes sort into four situations:
- No individual control, spare budget for a placebo. Rare in practice.
- Individual control and spare budget for a placebo. A ghost ads or PSA holdout fits.
- No individual control, no spare budget. Geo lift fits.
- Individual control, no spare budget. An audience holdout or a platform's own conversion lift test fits.
The rule, stated as a decision: no individual control means geo lift. Individual control with no placebo budget means an audience holdout or a platform's own conversion lift test. Individual control with placebo budget means ghost ads or a PSA holdout.
Audience (user-level) holdout
An audience holdout randomly withholds a message or ad from a subset of an addressable list, such as email, a catalog, push notifications or digital ads, and compares outcomes against the exposed group. It needs a channel where you control delivery down to the individual, which rules it out for anything you can't address by name or device ID.
Geo lift / matched market test
A geo lift test changes marketing in selected regions and compares outcomes to a randomly assigned or synthetic-control comparison region. It's the design for channels where you can't isolate individuals: broad TV buys, out-of-home, and any retail or QSR chain where the sale happens in a physical store rather than on a tracked device. Choose geo lift when your revenue is in-store-heavy and audience holdout isn't an option.
Platform conversion lift
Meta, Google and other ad platforms run this test for you inside their own tools. This is what most people mean by a conversion lift test: the platform randomly assigns eligible users into a test group and a holdout, then compares conversions between them.
The part that rarely gets explained is how that comparison actually works on Meta, described in a 2018 paper by Liu, Bettaney and Chamberlain presented at the AdKDD workshop. Meta scales the holdout up to match the test group's size.
It then blends conversions from users who were actually served the ad, called "reached," with users the platform meant to serve but didn't, called "unreached." That blending adds variance beyond a standard randomized A/B test.
The practical consequence: a platform's own "no significant lift" verdict can simply mean the test lacked the statistical power to detect a real effect, not that the channel produced no effect at all. Section four covers how to read that result correctly.
Ghost ads / PSA holdout
A PSA holdout shows the control group a placebo, such as a charity or brand-neutral ad, instead of nothing. It removes the noise of "any ad" versus "no ad" from the comparison, at the cost of real ad spend that converts into nothing for the control group.
Ghost ads solve the cost problem: the control group sees a competing advertiser's real ad instead of a placebo, so the test runs free. Ghost ads work best for acquisition campaigns, not retargeting.
Ghost bids are the retargeting-specific fix: a variant that removes users unavailable on the ad exchange from both groups before comparing, cutting noise while staying free to run. All three build a control group without simply showing no ad, and each shows up most often inside ad-tech platforms and mobile measurement partners rather than general marketing guides.
One shortcut isn't a real fifth design: comparing sales from a "before" period to an "after" period, with no control group running the same weeks. Anything else that changed during that window, a competitor promotion, a seasonal swing, a price move, gets credited to the campaign. Treat a before/after comparison as a sanity check at most, never as a stand-alone result.
Sizing and running the test
An incrementality test needs a holdout percentage, a duration, and a primary KPI decided before launch, sized to your channel's own conversion volume rather than copied from another team's defaults.
Run it in this order:
- Set the KPI and the decision threshold first. Decide what "worth keeping" looks like in lift or iROAS terms before you see a single result.
- Pick the design from the section above, based on what you can control and afford.
- Size the holdout and duration to your own conversion volume, not a rule of thumb borrowed from another channel.
- Set up the control, whether that's a suppressed list, a matched geo, or the platform's own holdout tool.
- Lock everything else during the test window. No creative changes, no budget shifts, no new targeting.
- Let it run the full planned duration. Checking early and stopping when it looks significant invalidates the result.
- Calculate lift, iCPA and iROAS, and make the call, using the same formulas the worked example below walks through.
Each step leans on the one before it. Sizing without a fixed KPI wastes the calculation later, and launching before the design is locked wastes the whole test.
It's tempting to reach for one universal minimum sample size. Resist it: a flat rule of thumb borrowed from another channel isn't derived from your own conversion volume, so treat it as a guess rather than a target.
Our minimum detectable effect guide walks through the actual power calculation behind the sample size you need. Use the presets below to get in the right range first.
Triple Whale's own GeoLift tool, for example, offers three preset combinations of holdout percentage and duration:
| Preset priority | Holdout % | Duration | Best when |
|---|---|---|---|
| Optimize for speed | 30% | 14 days | You need a fast read and can absorb a larger holdout |
| Balanced | 20% | 21 days | Default choice for most mid-size campaigns |
| Minimize revenue impact | 10% | 28 days | The channel is too valuable to hold back 20-30% of it, so the test runs longer instead |
A channel converting a few hundred times a week is too small to isolate reliably at any of these presets. The holdout gets thin, and normal week-to-week noise swamps a real effect.
Seasonality gets handled by the test structure itself rather than a separate correction, since both the test and control groups live through the same calendar. The comparison already cancels out most of it, as long as the test doesn't straddle a major seasonal shift like a holiday sales spike.
A worked example, start to finish
Here's one scenario carried through every calculation, using illustrative numbers rather than a real campaign.
A prospecting campaign has 500,000 eligible users. At a 15% holdout, that's a 75,000-user control group that sees none of the campaign's ads. Over the test window, the test group logs 8,500 conversions. The holdout's conversions get scaled up to match the test group's size, landing at 7,225 conversions.
Incremental conversions are the test group's total minus the scaled control's: 8,500 minus 7,225 is 1,275 incremental conversions, for a 17.6% lift (1,275 divided by 7,225).
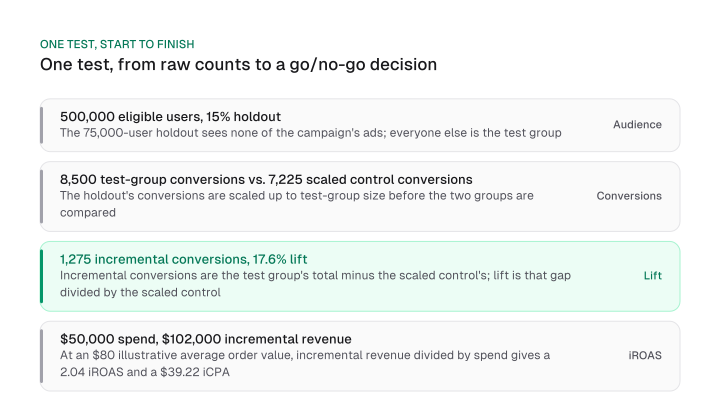
The campaign spent $50,000. At an $80 illustrative average order value, 1,275 incremental conversions produce $102,000 in incremental revenue.
Incremental cost per acquisition, or iCPA, is spend divided by incremental conversions: $50,000 divided by 1,275 is $39.22. iROAS is incremental revenue divided by incremental spend: $102,000 divided by $50,000 is 2.04. At those numbers, the campaign clears most teams' bar for a go decision.
Reading the result
An incrementality test's result is only positive, negative or inconclusive relative to its own uncertainty, and a platform's own "no significant lift" verdict deserves extra scrutiny because of how it blends reached and unreached audiences.
| Result pattern | What it means | Next step |
|---|---|---|
| Clear positive lift | The test group converted meaningfully more than the scaled control | Calculate iROAS and compare it to your threshold before scaling spend |
| Clear negative or zero lift | The channel isn't producing conversions beyond baseline | Pause or reallocate the spend, the way Uber did with its Meta test |
| Inconclusive, standard test | The holdout was too small or the test too short to detect the effect | Rerun with a larger holdout, a longer window, or both |
| Inconclusive, platform conversion lift | The reach/unreached blending added variance a standard test wouldn't have | Check the confidence interval before writing the channel off; the pass/fail label alone won't show it |
A "no significant lift" verdict means the test couldn't rule out zero effect at its chosen confidence level. That's a narrower claim than "the channel had no effect," and platform-run studies reach that narrower verdict more easily than a standard randomized test, because of the reach/unreached blending covered above.
iROAS and attributed ROAS answer different questions. Attributed ROAS credits every conversion an ad touched. iROAS credits only the conversions the holdout comparison says the ad caused. The two numbers can disagree by a wide margin on the same campaign, which is exactly the gap incrementality testing exists to close.
A forecast estimates what should happen; an incrementality test measures what did. The same gap separates a modeled SEO forecasting estimate from a live traffic experiment, and it's why one never substitutes for the other.
Where incrementality tests go wrong
Most failed incrementality tests fail before the results come in, from an underpowered holdout, a mid-test change, or a before/after comparison run with no control at all.
| Failure mode | Why it happens | The fix |
|---|---|---|
| Peeking early and stopping once it looks significant | Random noise crosses a significance threshold by chance before the planned sample size is reached | Fix the sample size and duration before launch; don't check results until the test ends |
| Changing two things during the test | You can't tell which change produced the lift you measured | Change one variable per test and hold everything else constant |
| No control group at all | Seasonality, competitor moves and price changes all get credited to the campaign instead | Add a genuine holdout, even a small one, before trusting a before/after number |
| Trusting a platform's "no significant lift" as proof of failure | The scaled, blended holdout carries more noise than a standard A/B test | Check the confidence interval and rerun with a larger holdout or longer window before pausing the channel |
| Treating one result as permanent | A test only describes the conditions it ran under | Repeat the test when the channel, audience or spend level changes materially |
A single test result also has a shelf life beyond the conditions it measured. Well-run incrementality tests still feed into, and get calibrated against, marketing mix modeling for the channels and time periods a live experiment can't cover; that broader triangulation is covered in Mission Growth's MMM vs. MTA breakdown.
Incrementality testing is the only method here that produces a real causal number instead of a modeled guess. It only works if you pick a design your channel can actually support, and read the result against its own uncertainty rather than a platform dashboard's implied confidence.
Pick the channel where your attributed and incremental numbers would most likely disagree. Size one test against its own conversion volume, and run it before you move another dollar of budget based on attribution alone.
Frequently asked questions
Can I incrementality-test SEO or organic content the same way I test paid channels?
Not the same way. Paid channels have an on/off lever at the individual or regional level; organic search doesn't, so you can't withhold rankings from a control group of searchers. Teams instead lean on geo holdout tests or heavily confound-controlled before/after comparisons, both weaker evidence than a paid-channel holdout, running into the same SEO attribution problem that makes organic ROI hard to prove in the first place.
What's the difference between PSA, ghost ads, and ghost bids?
All three build a control group without simply showing no ad. A PSA holdout spends real budget on a charity or placeholder ad, trading cost for a clean read. Ghost ads show a competing advertiser's real ad for free, working best for new-customer campaigns rather than retargeting. Ghost bids strip exchange-unavailable users from both groups to cut noise for free.
Can you run incrementality tests on every channel at once?
Yes, with nested holdout groups: one control audience gets excluded from every channel at the same time, instead of one channel at a time. It needs a larger sample than a single-channel test, plus a check for interaction effects, since two campaigns can offset each other's lift signal.
Does a positive iROAS always mean the campaign was profitable?
No. iROAS measures incremental revenue against incremental spend, separate from profit. A 2.04 iROAS means just over two dollars of incremental revenue for every dollar spent; apply your contribution margin before calling it profitable, since revenue and margin sit on different lines of the same test.
How often should you repeat an incrementality test?
Repeat it whenever the channel, audience or spend level changes materially. A fixed schedule doesn't capture that: a result only describes the conditions it ran under, so a test from six months ago says nothing about a channel whose targeting or budget has since shifted.
Figures and images in this post are free to reuse under CC BY 4.0 with credit to Mission Growth.
Get Mission Growth highlighted in your Google results.