Minimum Detectable Effect: How to Calculate and Choose One
Minimum detectable effect (MDE) sets how much traffic your A/B test needs. See the formula, a worked example, and a framework for choosing the right MDE.
On this page
Minimum detectable effect (MDE) sets how much traffic your A/B test actually needs. It's the smallest true lift your test is built to catch, computed from your baseline rate, significance level, power and sample size. The common shorthand stops there: a smaller MDE needs more traffic.
That part is true, and it's not the hard part. The hard part is picking an MDE tied to a business decision instead of whatever a calculator defaults to.
The effect your test actually observes will almost never equal the MDE you sized it for. A result that lands below your planned MDE is not automatically a red flag.
In this guide: the minimum detectable effect formula (and exactly where the common shortcut breaks), the real traffic cost of halving your MDE, a three-step framework for choosing an MDE instead of accepting a calculator's default, and the three mistakes teams make most often.
What is a minimum detectable effect, and how do you calculate it?
Minimum detectable effect (MDE) is the smallest true difference between your control and variant that a test is built to catch, calculated from your baseline rate, significance level, power and sample size.
Set it too low and you'll need more traffic than you have. Set it too high and the test will miss lifts that would have been worth shipping.
MDE is a design choice you fix before the test runs, built from four inputs:
- Baseline rate. The current conversion rate (or other metric) you're testing against.
- Significance level (alpha). How often you'll tolerate a false positive, usually 5%.
- Power. Your test's statistical power: the chance of catching a real effect if one exists, usually 80%.
- Sample size. How many visitors or users land in each arm.
Any three of these fix the fourth. That's the minimum detectable effect formula in one sentence: solve it for MDE given a sample size, or solve it for the sample size a target MDE needs.
The formula is often stated as a relative percentage of baseline: (desired lift ÷ baseline) × 100%. That shortcut only works when the metric itself is a proportion bounded between 0 and 1, like a conversion rate.
The general definition is not tied to one metric type: it's an absolute effect size, defined that way in Chabé-Ferret's Theorem 7.2 on statistical power. MDE (two-sided) ≈ (Φ⁻¹(power) + Φ⁻¹(1 − alpha/2)) × √(variance of the estimator). Run the relative shortcut on revenue per user or time on page instead of a rate, and it breaks, because those metrics aren't bounded the way a proportion is.
The MDE formula
The two-proportion formula runs on the standard normal quantiles for your chosen alpha and power, the common case for conversion or signup rates.
At two-sided 5% significance and 80% power, z(0.975) = 1.96 and z(0.80) = 0.8416. Their sum is 2.8016, and the squared sum, 7.8489, is the constant that grows with your baseline variance to produce the MDE.
The formula runs in either direction. Feed it a sample size and it returns the MDE you can detect. Feed it a target MDE and it returns the sample size you need.
A worked example
Say your baseline conversion rate is 8%, and you want to detect a 15% relative lift at 5% significance and 80% power.
Solve the same formula for sample size instead of MDE and you need about 8,565 visitors per arm, 17,130 total, to reliably catch that effect.
Exactly how much traffic halving your MDE costs
Minimum detectable effect shrinks with the square root of sample size, so cutting your MDE in half needs roughly four times the traffic.
Our growth experiment cadence guide already states that relationship and turns it into a weekly testing pace. Here's the exact table behind it, at one fixed baseline, plus a correction to the "exactly four times" shorthand.
At an 8% baseline conversion rate, 5% significance and 80% power:
| Visitors per arm | Absolute MDE | New rate | Relative MDE |
|---|---|---|---|
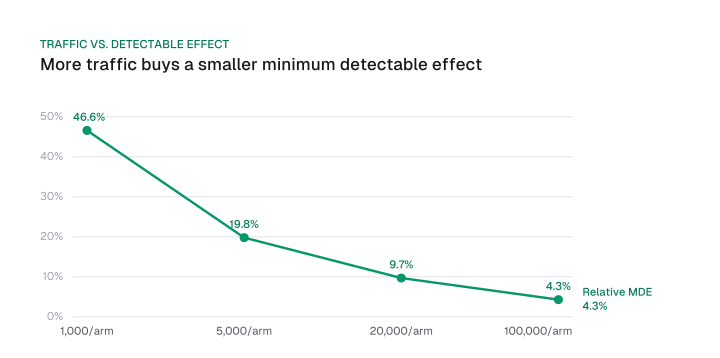
| 1,000 | 3.73 pp | 11.73% | 46.6% |
| 5,000 | 1.59 pp | 9.59% | 19.8% |
| 20,000 | 0.78 pp | 8.78% | 9.7% |
| 100,000 | 0.34 pp | 8.34% | 4.3% |
Download CSV (CC BY 4.0)
Going from 1,000 to 100,000 visitors per arm takes the detectable relative MDE from 46.6% down to 4.3%, a tenfold drop in the effect size you can catch for a hundredfold increase in traffic.
Halving your target MDE from 15% to 7.5% relative, the worked example above, needs 33,185 visitors per arm instead of 8,565: a 3.87x increase.
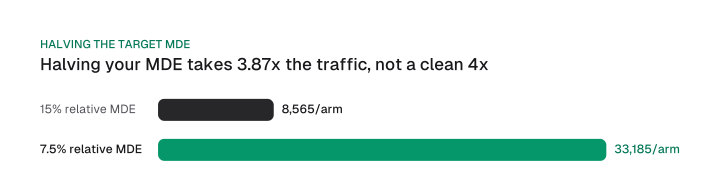
The "halving quadruples it" shorthand rounds that up to a clean fourfold jump. The real multiplier lands just under it, because the variance term itself shifts slightly as the target rate moves.
Lowering your MDE without more traffic
CUPED and similar variance-reduction techniques lower your MDE without more traffic, see CUPED.
Stratification and covariate adjustment work the same way: they cut the variance in your estimate rather than adding visitors, which tightens your MDE at the same sample size.
The same 1/√n relationship sets how many AI answers you need to sample before a citation-share number stops moving, see prompt volume.
How to choose an MDE for your test
The right MDE is the smallest lift that would change your decision to ship, checked against whether your traffic can power it inside a timeline you can live with. There's no universal "good" MDE.
A number pulled straight from a calculator's default has no relationship to what actually matters for your business.
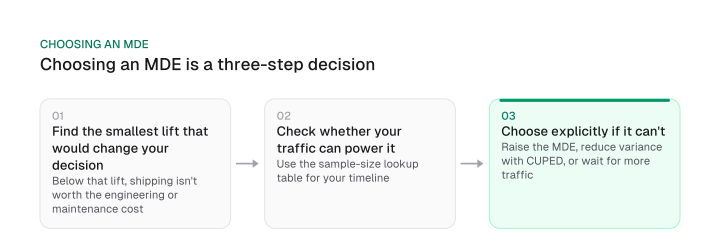
Three steps decide it:
- Find the smallest lift that would change your decision. If a 2% lift wouldn't justify shipping the change, given engineering cost, maintenance and risk, but a 10% lift would, your MDE starts near 10%, not 2%.
- Check whether your traffic can power that MDE inside a timeline you can live with. Use the lookup table above. A page getting 1,000 visitors per arm a month can only reliably catch effects near 46.6% relative, far above what most changes deliver.
- If it can't, choose explicitly between three options. Raise the MDE and test for a bigger, riskier bet, reduce variance with CUPED, or wait for more traffic. Never default silently to whatever a calculator suggests.
Growth teams ask the same practical-significance question whenever they size any investment. See how we size that for SEO ROI.
Common MDE mistakes and misconceptions
MDE gets misread three ways most often: chasing a fixed n=30 floor, treating a single number as a universally "good" effect size, and comparing the observed effect to the planned MDE as if the two should match.
The "30 is the minimum sample size" myth
Thirty is not a real minimum sample size. Whether the normal approximation that MDE formulas rely on kicks in depends on how skewed the underlying distribution is. A fixed sample-size count doesn't decide it.
Oxford economist DiTraglia's own simulations show why. 10 draws from a Uniform(0,1) distribution already look close to normal. 100 draws from a Bernoulli(1/60) distribution gave 82% actual coverage on a nominal 95% confidence interval, short of the 95% that interval promises.
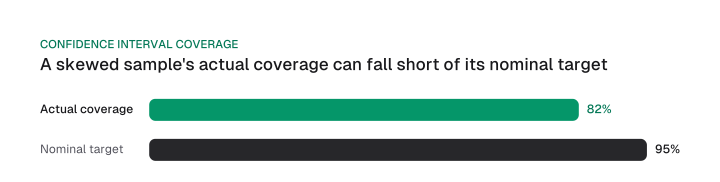
The real minimum sample size for an MDE calculation comes from your baseline rate, target lift, alpha and power, never from a constant borrowed from a textbook.
Is 0.3 a good effect size?
No number is universally "good." Cohen's own bands, 0.2 for a small effect, 0.5 for medium, 0.8 or above for large, were proposed as a fallback for fields with no domain-specific way to judge it.
A 2012 peer-reviewed guide puts it plainly: "these ballpark categories provide a general guide that should also be informed by context." Judge your own result against the business-relevant impact from the decision rule above.
Your observed effect won't match your MDE (and that's fine)
MDE is a hypothetical quantity, fixed before the test runs. The effect your test actually observes is a statistic computed from real data.
A significant result with an observed effect below the MDE you planned for is expected. It doesn't mean your test is broken: the two numbers answer different questions and were never going to line up exactly.
Peeking at results before a test ends is a related but separate problem: it changes your actual false-positive rate no matter what MDE you set. See sequential testing for the group-sequential designs and always-valid inference built to handle that.
Picking an MDE tied to a business decision, and reading your test's result against what MDE actually promises, matters more than which calculator you use. Run the worked example above with your own baseline and traffic before your next test.
Frequently asked questions
Why is 30 the minimum sample size?
It isn't. DiTraglia's simulations show that a distribution's shape, not a fixed count, determines when the normal approximation holds: some distributions look normal at n=10, others still miss their target coverage at n=100. Size your test from your baseline rate, target effect, alpha and power instead.
Is 0.3 a good effect size?
No number is universally good. Cohen's 0.2/0.5/0.8 small/medium/large bands were meant as a fallback for fields without a domain-specific way to judge effect size. Judge your result against what a lift that size means for your business.
What's the difference between minimum detectable effect and minimum detectable difference?
Nothing changes about the math. "Minimum detectable effect" is the term growth and CRO teams use; "minimum detectable difference" is the same concept under the name medical and econometric literature often gives it.
Is there a minimum detectable effect calculator?
Yes, and an MDE calculator is genuinely useful once you understand the formula above: it runs the same equation, solving for MDE or sample size depending on what you enter. Knowing the formula first means the calculator's number stops being a black box.
What sample size do I need for a 5% MDE?
It depends on your baseline rate: a 5% relative MDE means something different at an 8% baseline than at a much higher one. Use the lookup table earlier in this guide as a reference point, and run the formula with your own baseline for an exact number.
Figures and images in this post are free to reuse under CC BY 4.0 with credit to Mission Growth.
Get Mission Growth highlighted in your Google results.