Loss Aversion Marketing Examples, Tactics and Limits
Loss aversion marketing's 'twice as powerful' claim comes from a hedged 1991 study. See how it differs from FOMO and scarcity, plus 6 tactics that keep trust.

On this page
Nearly every page ranking for loss aversion marketing states the same claim: losses are twice as powerful as gains, straight from Kahneman and Tversky's 1979 paper. The real number tells a different story.
Read the 1991 paper the figure actually comes from and the picture changes. The coefficient is a hedged, single-experiment estimate the authors call for treating with caution. It comes from a narrower kind of choice than the 1979 paper covers.
Later research disputes the size of the effect too. None of the pages repeating "twice as powerful" cite it.
This guide traces the real citation chain, gives you a table to sanity-check your loss aversion advertising tactics, and shows where loss framing works in a real funnel, plus how to test it before you scale it.
What loss aversion marketing is, and where the "twice as powerful" number actually comes from
Loss aversion marketing is copy and offer design built on the loss aversion bias: Daniel Kahneman and Amos Tversky's 1979 finding that losses register more strongly than equivalent gains.
The specific "twice as powerful" figure comes from separate, later research, published over a decade afterward. The 1979 paper, "Prospect Theory: An Analysis of Decision under Risk" (Econometrica), established the qualitative claim only. It never attached a number to that weight.
The number everyone quotes comes from a different paper: Tversky and Kahneman's 1991 "Loss Aversion in Riskless Choice: A Reference-Dependent Model" (Quarterly Journal of Economics).
It reports a coefficient "slightly greater than two" from a mug trading experiment. A gambling task showed a similar ratio, roughly 2:1 to 2.5:1 of loss to gain; the authors combined it with the mug figure to reach their "about two" coefficient.
The authors add their own caveat right after both figures: "the convergence of estimates should be interpreted with caution." They also note the coefficient "could vary across dimensions," the subject of the next section.
That's the correction worth remembering before you use the number in a deck. The "twice as powerful" line often gets treated as settled fact. It is really a 1991 estimate from one mug trading experiment, published twelve years after the 1979 origin paper.
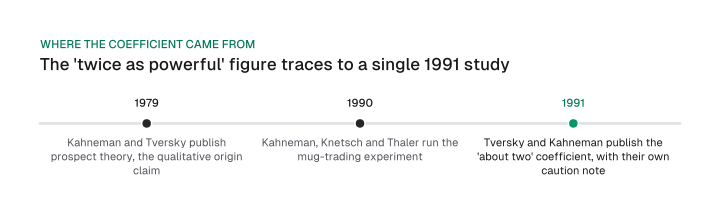
Laid out in order: in 1979, Kahneman and Tversky publish prospect theory, the qualitative origin claim; in 1990, Kahneman, Knetsch and Thaler run the mug-trading experiment; in 1991, Tversky and Kahneman publish the "about two" coefficient, with their own caution note attached.
The mechanism behind loss aversion: a reference point that moves
Loss aversion works because people judge outcomes against a reference point, and that reference point shifts with context. Tversky and Kahneman's own 1991 model reports the coefficient as dimension-specific rather than one fixed constant.
Their model shows the effect is more pronounced for safety than for money, and more pronounced for income than for leisure. That distinction draws on earlier safety-value research by Viscusi, Magat and Huber.
That difference matters for anyone running loss aversion advertising tactics outside a plain discount page. A framing trick that lifts clicks on a price offer will not automatically carry the same strength into a safety warning or a feature downgrade.
Independent evidence outside human self-report backs the underlying preference. Chen, Lakshminarayanan and Santos, published in the Journal of Political Economy in 2006, tested capuchin monkeys on two bets with identical expected value: one framed as a sure gain, one framed as a loss from a starting endowment.
The monkeys consistently preferred the gain-framed bet. That is evidence the preference runs deeper than a learned marketing trick: it shows up in a species that has never seen an advertisement.
Loss aversion vs FOMO, scarcity, the endowment effect, sunk cost and anchoring
Loss aversion is the bias underneath five other tactics: FOMO, scarcity marketing, the endowment effect, the sunk cost fallacy and anchoring. Confusing them means picking the wrong tactic for the wrong moment.
The table below maps all six to what actually triggers them, and the marketing move each one supports.
| Bias or tactic | What triggers it | Marketing tactic |
|---|---|---|
| Loss aversion | A reference point makes a loss loom larger than an equal-sized gain | Frame the offer around what the reader stands to lose |
| FOMO | Social pull from what other people visibly have or are doing right now | A live-viewer counter or a message naming how many people are looking |
| Scarcity marketing | Limited availability or time manufactures a loss frame around inaction | A countdown timer or stock counter tied to real limited inventory |
| Endowment effect | Owning or trialing something raises its perceived value above a non-owner's | A free trial that hands over the product before asking for payment |
| Sunk cost fallacy | Resources already spent and gone keep someone continuing a losing course | Progress or step displays that emphasize effort already invested |
| Anchoring bias | An earlier, often unrelated number sets the reference point for later value | A crossed-out original price shown beside the discounted one |
Two neighbors sit outside the table and deserve a line each. Risk aversion is a symmetrical preference for certainty regardless of framing; loss aversion is asymmetric, weighting a loss more than an equal gain. Status quo bias is a preference for keeping things as they are; loss aversion is a big reason change feels risky in the first place.
Two of these pairs cause the most confusion in practice.
Endowment effect vs loss aversion
The endowment effect is loss aversion applied to something you already have, or feel you have. Giving it up registers as a loss.
The clearest evidence for the size of that gap comes from the mug trading experiment behind the 1991 coefficient. Sellers who had been handed a mug valued it at a median $7.12 (and $7.00 in a replication).
Choosers who never owned the mug valued the identical object at a median $3.12, and $3.50 in a replication, the same figures Tversky and Kahneman published in 1991.
Ownership alone, even briefly, roughly doubled the price people put on the mug: 2.28x in one experiment, exactly 2x in the replication. Endowment effect vs loss aversion comes down to the same reference-point mechanism: once you have something, losing it hurts more than never having gained it.
That is the mechanism behind letting a prospect use your product in a free trial before you ask for a credit card. Once they have had it, giving it up already feels like losing something they had, a stronger pull than simply missing out on a discount.
Loss aversion vs FOMO
Loss aversion vs FOMO comes down to who supplies the pressure. FOMO borrows urgency from other people's visible behavior; loss aversion needs no crowd at all.
A live-viewer counter or a message naming how many people are currently looking at an item works through social proof and fear of exclusion. A renewal email that names the specific feature you will lose next month works through your own reference point instead.
The two tactics often get stacked in the same campaign. A test that isolates one from the other tells you more than a test that changes both at once.
Loss aversion vs scarcity marketing
Loss aversion vs scarcity marketing is a source-and-tactic distinction: scarcity manufactures a loss frame around inaction, using limited availability or a deadline, while loss aversion is the underlying reaction it borrows.
Loss aversion vs the sunk cost fallacy
The sunk cost fallacy runs on resources already spent and gone: continuing anyway reacts to money or time already sunk. Loss aversion instead frames a change that hasn't happened yet.
Tactics: putting loss aversion to work across your funnel
Loss framing recurs in six places in a typical B2B SaaS or e-commerce funnel: discounts, free trials, renewals and loyalty programs, forms and cart abandonment, scarcity signals, and B2B pitches.
The same rewrite pattern applies to all six: name the specific thing being lost, against a reference point the reader already holds.
Here is what that rewrite looks like on a renewal email, a common spot for loss aversion marketing examples because the reader already has something concrete to lose.
Gain-framed original: "Upgrade to Pro and get priority support, unlimited exports and custom reports."
Loss-framed rewrite: "Your plan drops priority support, unlimited exports and custom reports at renewal. Keep them by upgrading before then."
Both sentences describe the same features and the same event. The second one names a reference point the reader already has, their current plan, and frames the change as something taken away instead of something offered.
Loyalty programs use the same mechanic: showing points or progress already earned frames stopping short as giving up something already held. Nunes and Drèze (2006), in the Journal of Consumer Research, describe the same idea under its own name, the endowed progress effect: artificial progress toward a goal, like a pre-stamped loyalty card, increases the effort people put in to finish it.
That pattern applies across the other five spots too:
- Discounts. Frame the amount as money kept against the plan's usual price rather than a bonus handed over.
- Free trials. Give access before asking for payment, so the endowment effect above does the framing automatically.
- Forms and cart abandonment. Show progress or an item already in the cart as something left behind rather than a fresh invitation. The same endowed progress effect applies to a form: a completion bar that already shows steps done pushes people to finish it rather than start over.
- Scarcity and countdown signals. Tie the countdown to something actually limited: real stock, a real deadline, nothing fabricated.
- B2B pitches. Quantify what a delay costs the buyer in their own numbers, alongside what the product adds.
Where loss aversion breaks down, and how to test it before you scale it
The size of the loss aversion effect is an open academic dispute, and the tactic is not ethically neutral by default.
Gal and Rucker, writing in the Journal of Consumer Psychology in 2018, reviewed the evidence and reached a blunt conclusion: "current evidence does not support that losses, on balance, tend to be any more impactful than gains." They call instead for "a more contextualized perspective of the relative impact of losses versus gains," not a fixed universal ratio: the effect's size depends on the specific choice being framed.
That conclusion did not go unanswered. In the same journal issue, Simonson and Kivetz published a response titled "Bringing (Contingent) Loss Aversion Down to Earth," and Higgins and Liberman published "The Loss of Loss Aversion: Paying Attention to Reference Points," both disputing Gal and Rucker's framing.
None of the three pieces settles the question. The size of the effect stays an open academic dispute on both sides.
What that means for your funnel: treat any percentage-lift claim you read in a marketing blog as unverified until you run the test yourself. None of those numbers trace to a checkable primary source, and the underlying academic literature disagrees on how large or universal the effect really is.
Test it, don't assume it
A/B test the loss-framed version against the gain-framed version on your own funnel and your own audience before rolling it out broadly.
Keep the ethics line simple
Use loss framing when the loss is real: an actual expiring discount, an actual limited stock count, features an account genuinely loses on downgrade.
Don't fabricate one. A countdown timer that resets, a stock counter that never runs low, or a "people are viewing this" number nobody measured all cross the same line.
What decides the ethics here is whether what you're telling the reader is true, separate from which tactic you picked.
A version of the same wording effect that makes a loss-framed offer feel more urgent also changes how a language model summarizes your brand, which is exactly why the same framing effect distorts llm brand sentiment scores tracked by AI-visibility tools.
If you are weighing how far a tactic can push before it stops helping the reader and starts pressuring them, the nudge-vs-boost line our content brief guide draws is a useful line to hold a loss-framed offer against.
Whatever loss-framed test you decide to run on your own funnel this quarter, judge the result with the same false-positive discipline as any growth experiment uses, before you commit a full campaign to either version.
Every section here comes back to one correction: the "twice as powerful" figure belongs to a single 1991 experiment with the authors' own caution attached.
Loss aversion itself is real and useful. The specific coefficient your last vendor blog post quoted deserves a second look before you repeat it.
Pick one place in your funnel from the tactics list above. Write both the gain-framed and loss-framed version. Run them against each other before committing a campaign to either.
Frequently asked questions
What are the criticisms of loss aversion theory?
The size and universality of the effect are disputed. Gal and Rucker (2018) concluded, in their own words, that "current evidence does not support that losses, on balance, tend to be any more impactful than gains," a conclusion contested in the same journal issue by Simonson and Kivetz and by Higgins and Liberman. Treat industry lift percentages as unverified until you test them yourself.
What is an example of loss aversion?
A reference-point example: the same discount reads as a bigger deal when it is framed as money kept against your usual price, instead of a bonus you are being given. The mug-trading experiment shows the same effect on ownership: sellers who had been given a mug valued it at a median $7.12, while choosers who never owned it valued the identical mug at $3.12.
Can you give an example of FOMO marketing?
A live-viewer counter, or a message naming how many people are looking at an item right now, works through FOMO. It borrows urgency from other people's visible behavior instead of the reader's own reference point, which is the mechanism loss aversion relies on.
What was Daniel Kahneman's theory of loss aversion?
Loss aversion is part of prospect theory, published by Kahneman and Tversky in 1979: losses register more strongly than equivalent gains. The specific "about two" coefficient came later, from a 1991 paper by the same authors.
Is loss aversion ethical to use in sales?
Yes when the loss is real: an actual expiring benefit, an actual limited stock count. No when it is fabricated: a countdown that resets, a stock counter that never runs empty. The line is whether what you are telling the buyer is true.
How is loss aversion different from anchoring bias?
Anchoring sets a reference point using an earlier, often unrelated number, such as a crossed-out original price. Loss aversion is the reaction once that reference point exists and a change from it gets framed as a loss.
Figures and images in this post are free to reuse under CC BY 4.0 with credit to Mission Growth.
Get Mission Growth highlighted in your Google results.