Test and Learn: A Guide With an Illustrative 40-Store Test
Test and learn is a method for proving a change works before you roll it out. See the steps, control groups, decision rules and a worked example.

On this page
Test and learn is a method for proving that a change works before you roll it out everywhere. You apply the change to some stores, customers or markets, withhold it from a comparable group, and roll it out only if the measured gain beats what the change costs.
A test and learn programme runs on a five-step loop: hypothesis, test, measure, roll out, learn. The loop is the easy part. The programme succeeds or fails on two things: who the control group is, and a numeric rollout threshold you fix in profit terms before any result exists.
In this guide:
- What the test and learn approach covers, and how it differs from A/B testing and from a pilot
- The five steps, with the decision memo that makes step 4 mechanical
- How to build a control group when you only have dozens of units
- An illustrative 40-store calculation, start to finish
- How to roll out in waves when withholding is not an option
What test and learn means
The test and learn method measures the incremental impact of a change by testing it on select groups and withholding it from matched control groups.
The change then rolls out only where the gain justifies the cost.
The test and learn methodology isn't tied to a product. Mastercard and MarketDial sell software under the name, but the method works with a spreadsheet and a careful assignment of stores.
A well-run test answers three questions:
- Network-wide impact: what happens to the whole business if the change goes everywhere.
- Uneven effects: which stores, segments or markets respond and which don't.
- Working components: which parts of a bundled change drive the result.
You can apply it to anything you can't reverse cheaply: a price, a promotion, a store layout, a staffing model or a new technology. It lets you reduce risk before the whole network carries it.
Test and learn vs A/B testing
The logic of test and learn vs A/B testing is the same: a change group, a comparison group and a measured difference.
What differs is the number of units you can assign.
A website splits its visitors at random in very large numbers, and a coin flip per visitor balances almost any trait. A retailer splits dozens of stores, and a coin flip can easily put the busiest stores on one side.
So the method needs more care with few units, which is the subject of the control group section below. If you want the digital version first, our guide to growth experiments covers what a single experiment is and gives examples by funnel stage.
Test and learn vs pilot
In the test and learn vs pilot question, a pilot is not a test.
A pilot answers "can we run this, and will staff accept it?" Only a concurrent control group answers "did it move sales?"
Run a change in five stores with no comparison group, and sales go up. You still don't know whether the change worked, or whether it was a warm month. The Behavioural Insights Team describes pilots as one point on a spectrum of practice, from pilots and check-ins at one end to embedding test and learn throughout an organisation at the other. Few organisations get to the far end.
Skipping the test is expensive. The UK Green Deal's assumptions went untested for three years, at a cost the Behavioural Insights Team puts at £240 million.
The five steps of the test and learn process
The test and learn process has five steps: write the hypothesis and decision memo, design the test, measure the net impact, decide the rollout, and record what you learned.
Each step ends with an artefact, so the loop can't turn into a slogan.

Step 1: write the hypothesis and the decision memo
State what will change and why. "An introductory offer raises weekly sales because shoppers who try the range reorder" carries a mechanism; "the offer will work" doesn't.
Then write a decision memo before launch. It fixes the rules while nobody knows the result:
Break-even lift is the promotion cost per unit divided by the product of baseline sales per unit and gross margin. It's the lift in sales that repays the cost in profit, so state the gross margin in the memo. A sales lift that looks healthy can still lose money when the margin is thin.
Step 2: design the test
Choose the unit, fix the duration and check what else is running in the same stores. Overlapping initiatives contaminate the comparison, and you can't untangle them afterwards. Set the end date before launch, because looking early and stopping on a good day inflates results. Sequential testing covers early looks if you need them.
Step 3: measure the net impact
Compare before and after for both groups, then subtract. The control group's change is what would have happened anyway.
Also check for a cannibalization effect: a promotion in one store can pull sales from neighbouring stores or from an adjacent category. Read those too, and report the net figure per store instead of the gain in the promoted line alone.
Step 4: decide the rollout
The rollout rule compares the result's interval with the break-even lift. There are three outcomes:
The middle row is the one teams improvise. If the interval straddles the break-even, the data can't tell you whether the change pays, so a full rollout is a bet, and the memo says in advance what happens instead. A targeted rollout to the segments that clear the line avoids paying for the segments that don't.
Step 5: record what you learned
Log the hypothesis, design, result and decision whether or not the change worked.
A failed test that's written down prevents the same idea returning in a year under a new name.
Matched control groups: how to build a fair comparison
A matched control group is a set of stores or customers chosen so that, before the change, they behave like the test group on the metric you will measure.
With a handful of units, random assignment can leave the two groups unbalanced by chance. Draw 20 stores at random from 40, and the busiest, fastest-growing stores may still land together on one side. That chance imbalance looks like a treatment effect afterwards.
The fix is called rerandomization. Before the experiment, check covariate balance on pre-period data. If the groups are unbalanced, redraw the assignment until it passes, as a 2012 paper on rerandomization sets out. Do the check before launch, since after launch the damage is done.
Here's what to match on:
- Baseline sales: the average level per store over the pre-period.
- Trend: the slope over the last several weeks, because a rising store and a flat store diverge without any change.
- Format and region: store type, size band and local market.
Then compare the pre-period lines for the two groups. If they run together, the assignment is fair. If they drift apart, redraw.
Don't assume balance. Mastercard's own analysis found natural test versus control bias in 45% of campaigns, so a comparison group that nobody built deliberately often carries bias before the test starts. For geo lift design and sizing, incrementality testing covers the statistics of a single test.
Test and learn worked example: 40 stores, one promotion
In a 40-store example, the promotion's true lift is 3.0%, not the 5.0% the test stores show alone, because control stores rose 2.0% over the same six weeks.
Every number in this example is an illustrative assumption we chose to show the arithmetic, so read it as a worked illustration, never as a case study or a measured result. Pricing tests and promotions are the same kind of change, so the calculation carries over to either. Treat this as one of the test and learn examples you can rebuild in a spreadsheet.
Here's the setup. There are 20 test stores and 20 control stores, 40 in all, each with baseline sales of $20,000 per store per week. The promotion costs $200 per store-week and the gross margin is 40%.
After six weeks, test stores average $21,000 per store-week and control stores average $20,400.
Walk the numbers:
- Test stores read alone: $21,000 against a $20,000 baseline is a 5.0% lift.
- Control drift: $20,400 against the same $20,000 is 2.0%, the seasonal lift every store got.
- True lift: 5.0% minus 2.0% is 3.0%, which is $600 per store-week (3.0% of $20,000).
- Break-even lift: the $200 cost divided by (baseline sales times the 40% margin) gives 2.5%.
- Profit from the true lift: $600 times the 40% margin is $240 per store-week, against $200 of cost.
On those figures the promotion pays. But the result is an estimate. Assume a 95% interval around the 3.0% true lift, which runs from 1.4% to 4.6%. That interval straddles the break-even lift of 2.5%.

The rule from step 4 now applies: you extend the test or target the stores that clear the line. The naive reading would have rolled out on 5.0% and a cost-versus-lift comparison that looked easy. Subtracting the control group removed the 2.0% of seasonal drift, and the interval showed that even the corrected figure isn't safe.
Staggered rollout: when you cannot hold stores back
A staggered rollout turns the rollout itself into the experiment: every store gets the change eventually, and the order of the waves is drawn at random.
Sometimes withholding isn't an option. The change is already promised, or the network is too small to keep half of it waiting. The mechanism comes from the stepped wedge design in clinical trials, where clusters cross from control to intervention on a staggered schedule. That schedule confounds the effect with time, as Li, Hughes, Hemming and colleagues explain in their 2020 overview of stepped wedge models.
The confound is the main risk. Stores treated later also face a later calendar. So read treated against not-yet-treated stores in the same week, and model the trend over time.

Two rules make the design usable:
- Randomised wave order: draw which group goes in which wave. Starting with the easiest stores builds a bias into the first reads.
- Keep not-yet-treated stores at every read: the last wave is your control until it switches, so never roll everything out in the final step before you have read the result.
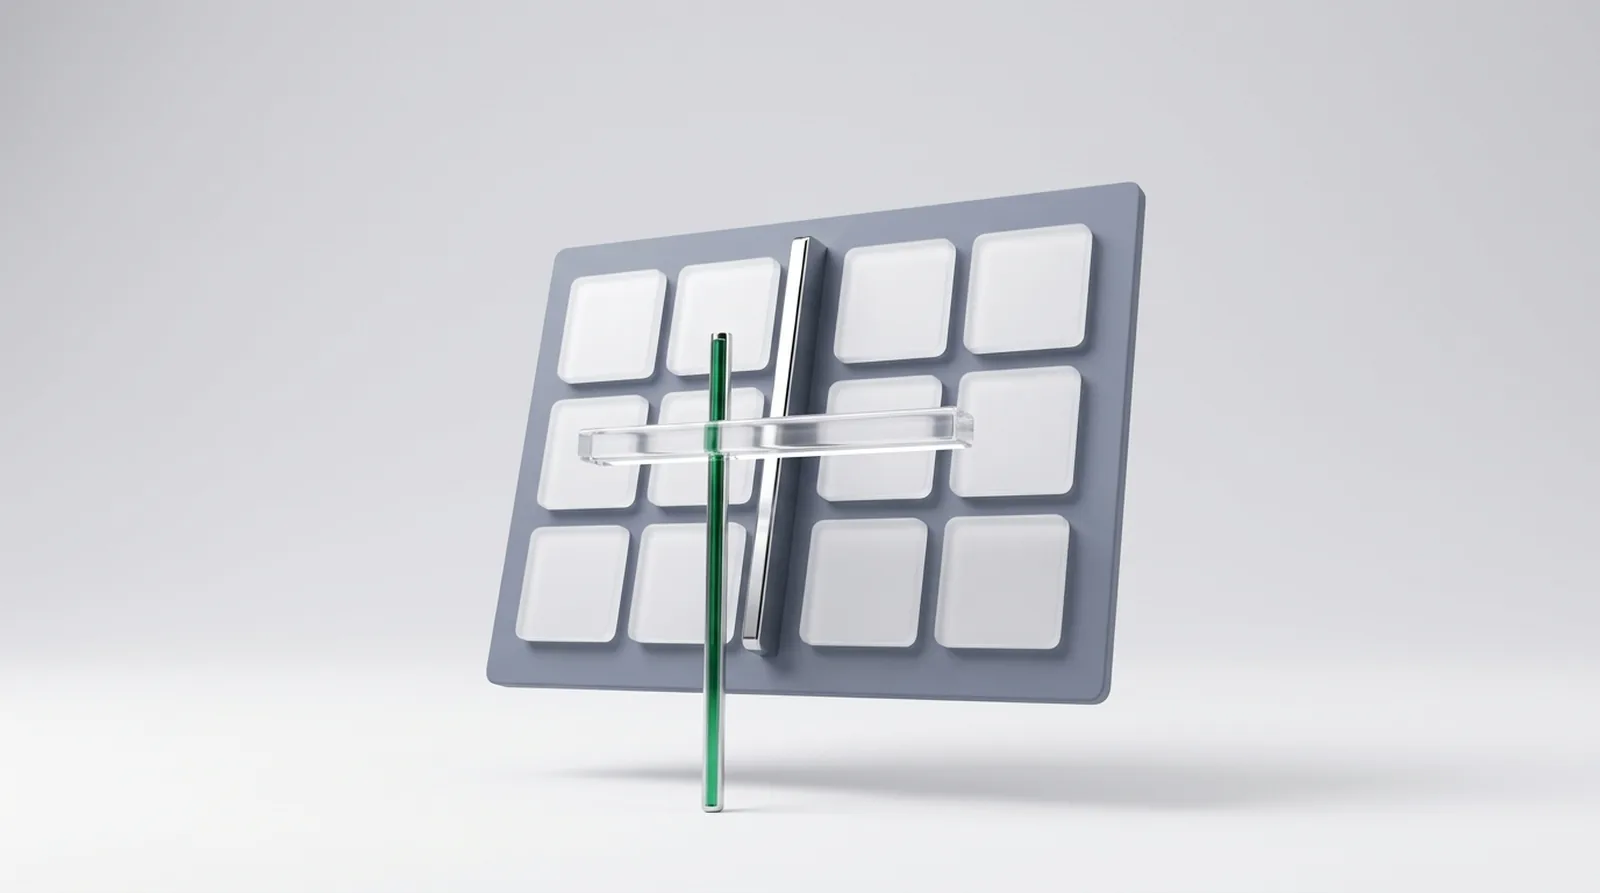
In the grid above, store groups A to D enter in waves 1 to 4, and in any given week the groups still waiting are the comparison.
This is a clinical design we borrow, and it has limits. It can fail if wave effects track calendar effects that your model can't absorb, for example a holiday that hits wave 3 only. With few stores, power is low too, so treat a staggered read as weaker evidence than a clean split.
Test and learn culture: commit to the decision before the result
Teams with a test and learn culture sign the decision rule before the result arrives, so a result that contradicts a senior opinion changes the decision without a debate.
The usual blocker is a result that disagrees with someone senior, discovered after the fact. Tools rarely come into it. If the break-even lift and the straddle outcome were signed before the result, the argument was already settled when the data came in. Keep the decision memo from step 1 and have the decision owner sign it before launch.
A first month can be small:
- Pick one change you're about to make anyway.
- Fill in the memo fields and get it signed before the result.
- Keep a results log with the hypothesis, unit, duration, true lift, interval, decision and what you would test next.
- Review the log together, including the tests that failed.
The Behavioural Insights Team's playbook found a quick survey, trialled in a controlled test on the National Tutoring Programme, raised attendance by 4.2 percentage points, which would have meant 1,600 more sessions had it been rolled out to the control group. That's what a small test buys you: a better next decision.
Few organisations embed this throughout. Starting with one signed memo is how a test and learn culture gets going. For how often to run tests and how to prioritise the backlog, see growth experiment cadence.
You can start this week: pick one change on your roadmap and write its memo before it ships.
Frequently asked questions
When should you not run a test?
Skip it when the change is cheap to reverse or the stakes are small.
A sharper rule: skip when the profit lost by rolling out a wrong change, taken at the low end of the interval, is smaller than the profit the test withholds from control stores. In the example, an $88 loss per store-week at the low end, over 40 stores and 52 weeks, is $183,040 of exposure.
The control stores forgo $4,800 of profit over the six weeks, so the answer is to test. Stakeholders should agree up front when a test is necessary.
What does test and learn mean?
It's a business method for changing a company in stages. You apply a change to a test group, withhold it from a matched control group, and roll it out only if the measured gain beats the cost. The result tells you what the change adds across the whole network.
What is the difference between test and learn and A/B testing?
The logic is identical: a change group, a comparison group and a measured difference. The practical difference is the number of units. A/B testing splits a very large number of visitors, so random assignment balances itself. Test and learn splits dozens of stores or markets, so you must build and check the control group.
How long should a test run?
Long enough to cover a full weekly cycle and to produce an interval narrow enough to compare with the break-even lift, with the end date fixed before launch. The worked example used six weeks. Stopping early on a good result inflates the apparent lift.
Is test and learn the same as a pilot?
No. A pilot checks that you can run a change and that staff accept it. Test and learn adds a concurrent control group, so it also tells you whether the change moved sales. A pilot can be the first stage of a test, but on its own it doesn't measure effect.
Cite this page
Aktaş, F. (2026, November 10). Test and Learn: A Guide With an Illustrative 40-Store Test. Mission Growth. https://missiongrowth.io/blog/test-and-learn
Figures we made for this post are free to reuse under CC BY 4.0 with credit to Mission Growth.