What Is Time to Value? The Formula and How to Fix It
Time to value (TTV) is the gap between signup and a customer's first real win. See how to measure it and fix the actual driver behind a slow one.

On this page
A flat list of six to ten onboarding tactics can't tell you which one actually shortens your time to value.
But that's backwards. A long clock almost always traces back to one of three root causes, and the fix for a handoff gap does nothing for a customer stuck waiting on their own data.
You'll get a defensible way to measure the metric here, then a way to diagnose which driver is slowing your own clock.
In this guide:
- What is time to value, and where the discipline behind it came from
- The five duration types, reconciled from two competing frameworks
- The time to value formula, plus a worked example you can copy
- The three root drivers of a long TTV, matched to the fix that removes each one
- Why a slow TTV costs you most of its damage before day 30
What is time to value (TTV)?
Time to value (TTV) is the duration between a defined start event, usually signup, and a defined value event, the customer's first meaningful outcome.
That sounds simple. Most teams stop at "how fast users get value" and never pin either end to a specific, named event.
A vague definition isn't measurable. TTV only works once both endpoints are locked to specific events, a discipline it borrows from a much older field than SaaS.
"Time-to-value" also shows up hyphenated, mostly as a compound modifier in front of a noun ("a time-to-value metric"). In running prose, "time to value" without hyphens is standard.
What does "value" actually mean?
Value, in a TTV context, is the first outcome a customer actually wanted, not account creation or a finished setup wizard.
A few time to value examples make the distinction concrete:
- Scheduling app. The win is a client booking a real appointment.
- BI dashboard. The win is an executive pulling a real number for an actual decision.
- E-commerce tool. The win is processing one live customer order.
The setup steps in each case are real work. The win a customer signed up for happens after them.
Where the metric came from, and what SaaS guides skip
Time to value didn't start in SaaS. It comes from IT and infrastructure project management, where a "benefit" needs an owner and a baseline before it counts.
The UK Government's own Project Delivery guidance defines a benefit as "the measurable value or other positive impact resulting from an outcome perceived as an advantage by one or more stakeholders, and which contributes towards one or more objective(s)."
Two conditions attached to that definition matter more than the wording:
- A named owner. Each benefit gets an individual who "confirms the benefit's identification and value, agrees the plan in the business case and then takes responsibility for realising and reporting on it."
- A baseline before work starts. "The current performance level for each benefit should be established before work starts," recorded as the baseline you measure against later.
No SaaS guide in this space applies that same rigor to its own value event. Give yours an owner and a pre-launch baseline, in your own words, and TTV stops being a feeling and becomes a number you can defend in a meeting.
Skip the government vocabulary. You need one person accountable for the definition and one number captured before you start measuring against it.
The five types of time to value (and the sixth one competitors disagree on)
Time to value splits into a small set of duration bands. The two frameworks that dominate the search results for this term don't agree on how many types there are or what to call them.
Read past the labels, though, and they describe the same axis with different names, plus two extra ideas that aren't duration bands at all.
Immediate, basic, short, long and exceed-value all sit on one duration axis, from near-instant to a value event that keeps compounding well past the first outcome.
"Perceived TTV" measures something else: how fast the wait feels rather than how long it actually is. A progress indicator can shorten perceived TTV without touching the real clock.
"Recurring TTV" asks a different question: how long it takes to reach the second, third or Nth value moment in a repeat cycle.
The honest count is five duration bands on one axis, plus two separate concepts that get bundled in with them by mistake.
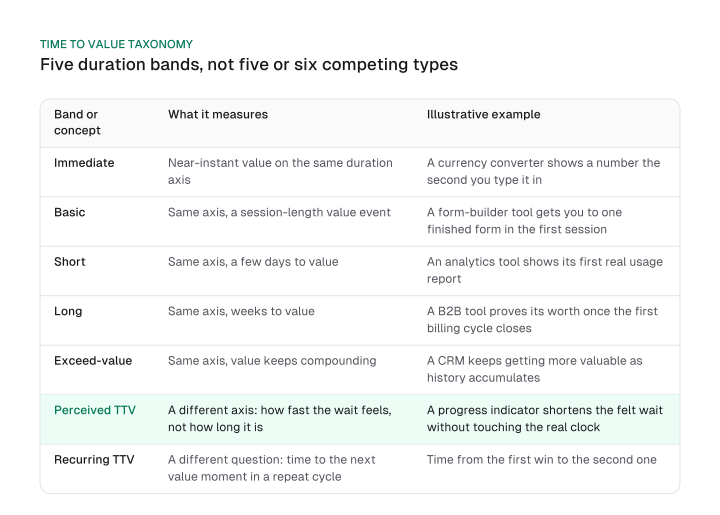
A few time to value examples make each band concrete:
- Immediate. A currency converter shows a number the second you type it in.
- Basic. A form-builder tool gets you to one real, finished form in the first session.
- Short. An analytics tool shows its first real usage report once enough data has accumulated.
- Long. A mid-market B2B tool proves its worth once the first billing cycle closes and a report shows the return.
- Exceed-value. A CRM keeps getting more valuable as more of a sales team's history accumulates inside it.
How to calculate and measure time to value
TTV equals the elapsed time between a customer's start event and their first value event, measured as a median, never a mean.
The time to value formula is one line, but almost every published "how to calculate TTV" answer stops there. A single number hides more than it shows, because nearly every TTV distribution has a long tail.
Picture a cohort of ten new customers who all signed up the same week. Sorted, their days to first value run 1, 1, 2, 2, 2, 3, 3, 4 and 5. One customer, blocked on a data import, takes 10 days, far longer than the rest.
That single straggler drags the mean well above where the typical customer actually landed. The median stays anchored to what most of the cohort experienced; the mean does not. Report the mean here and you'd tell a room TTV is worse than it is for nearly everyone in the cohort.
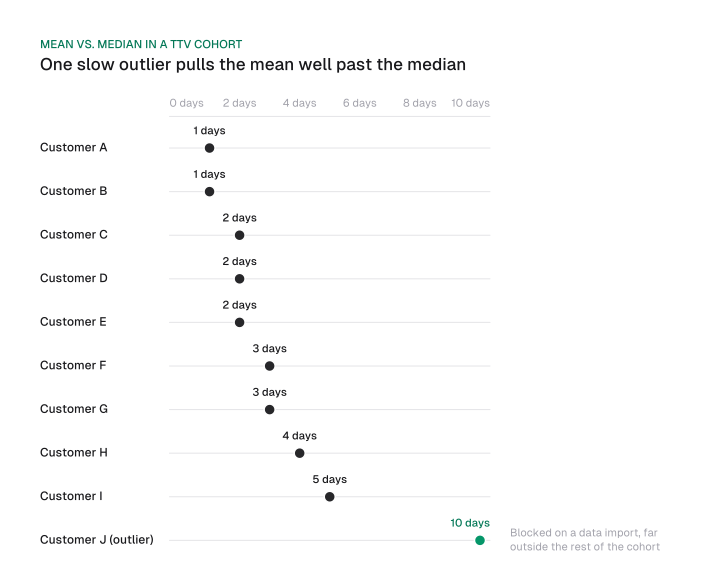
Don't stop at the median. Track percentiles alongside it: the 50th shows what a typical customer experiences, the 75th and 90th show how bad the tail gets.
In the cohort above, the 90th percentile is that single outlier, exactly the customer a customer-success team should call while there's still time, before they churn.
Before you pick a start and value event, apply the same check from the definition above: assign one owner, and freeze a baseline before you start reporting the number. That keeps a later process change from quietly redefining what "value" means mid-stream.
If you already run cohort analysis for other retention questions, the same cohort tables let you split TTV by signup month, channel or segment instead of reporting one blended number for every customer type.
What drives a long time to value, and which fix actually removes it
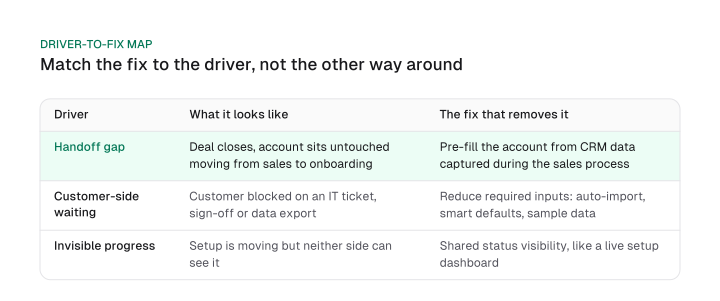
A long time to value almost always traces back to one of three root causes: a handoff gap between sales and onboarding, customer-side waiting on data or approvals, or invisible progress that neither side can see.
A flat list of six to ten onboarding tactics gives no way to choose between them. Matching each driver to the tactic that actually removes it turns that list into a diagnostic instead of a menu.
Each driver needs a different fix:
- Handoff gap. A deal closes and the account sits untouched while it moves from sales to onboarding, sometimes for days. Pre-filling the account from CRM data captured during the sales process removes the gap outright, rather than papering over it with a better onboarding email.
- Customer-side waiting. The customer, not your team, is the bottleneck: an IT ticket for API access, a manager's sign-off, a data export from a legacy system. Reduce what you need from the customer up front instead of chasing them to move faster. Auto-import from a common source, smart defaults instead of required fields, and sample data the customer can explore while their real import runs in the background all shrink this driver directly. A hands-on customer success manager who clears the specific blocker by phone works too, but it doesn't scale the way removing the requirement does.
- Invisible progress. A multi-step setup is genuinely underway, but neither side can see it, so the customer assumes nothing is happening and opens a support ticket or quietly disengages. Shared status visibility, like a live setup dashboard both sides can see, removes this driver without shortening a single step.
Match the fix to the driver, and you reduce time to value without guessing which of ten tactics to try first.
Treat technical friction as an accelerant of the other two drivers, rather than a fourth driver on its own: an error a customer hits mid-setup turns a short wait into a support ticket and a much longer delay, which makes proactive error monitoring during onboarding worth the engineering time.
Staring at three or four fixes that all qualify? Ranking them is a prioritization problem, and the ICE and PIE frameworks in our guide to running an experiment cadence handle exactly that step. Read it before you commit engineering time to any one fix.
Designing an onboarding checklist that actually shortens perceived time to value
A checklist that starts at zero completed steps slows a new user down more than one that opens with a step or two already checked off.
Most SaaS advice to "add a progress bar" misses the part that actually matters: where the checklist starts.
A 2006 Journal of Consumer Research study on the endowed progress effect found the mechanism directly. Converting an eight-step task into a ten-step task, with two steps already marked complete, increased how likely people were to finish it and shortened how long it took them to get there.
The mechanism is perceived distance to the goal, rather than the real number of steps remaining. A car-wash loyalty card with two of ten stamps already punched gets finished faster and more often than a blank ten-stamp card, even though the customer has to complete the exact same number of washes.
For example, your account-setup checklist can auto-check "created your account" the moment a customer signs up, rather than opening with five unchecked boxes where the first one is "create an account."
Two caveats apply:
- Different context. The original finding is a physical loyalty card at a car wash, not a software checklist, and it hasn't been independently replicated inside SaaS onboarding as far as the research behind this guide found. Treat the transfer as a strong hypothesis worth testing on your own product.
- Authenticity matters. The effect depends on the pre-completed step being something the customer genuinely already did. Pre-checking a step nobody actually finished risks reading as manipulative instead of motivating, a boundary the original study doesn't test.
Why time to value matters, and what counts as "good"
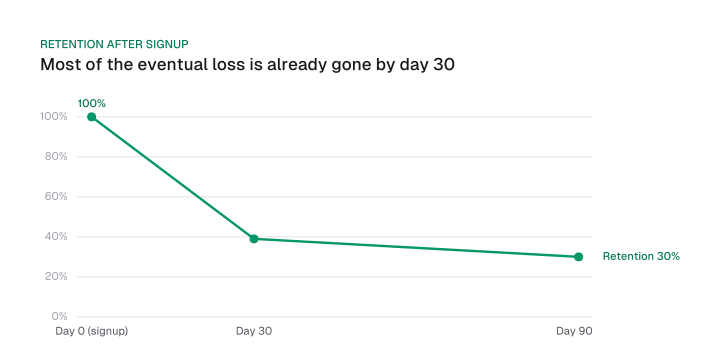
A slow time to value costs a product most of its eventual first-quarter churn in the first 30 days.
That front-loaded pattern, more than any generic "TTV matters for retention" claim, is what should set your urgency.
There's no universal "good TTV" figure, and any guide handing you one is guessing. Time to value SaaS benchmarks vary by go-to-market motion instead of by industry:
- Self-serve, low-touch. Hours to days.
- Mid-market B2B. A few weeks.
- Enterprise. Weeks to months.
Comparing your enterprise TTV against a self-serve benchmark tells you nothing useful.
What tells you something useful is how fast the cost compounds. Pendo's January 2025 benchmark report found products retaining 39% of users after one month and 30% after three months.
Read those two numbers together: of the roughly 70 percentage points of users a product eventually loses by day 90, about 61 of them (100 minus 39) are already gone by day 30. That's roughly 87% of the eventual 90-day loss, already locked in within the first 30 days.
Whatever your go-to-market motion, most of the damage from a slow TTV happens in that first window. That's the real argument for treating TTV urgently instead of chasing a borrowed "golden window" number from a different kind of product.
The same pattern shows up in other metrics that take time to mature. Our guide to SEO ROI makes the same point about a completely different number: a metric's return has its own timeline, and the early part of that timeline carries disproportionate weight.
TTV reflects a broader investment-maturity curve rather than a pattern unique to SaaS: whenever a payoff is delayed, the early part of the timeline carries the risk, the same idea behind content ROI and a well-defined SEO KPI.
Time to value determines whether a customer sticks around long enough to become one worth keeping. A slow TTV compresses lifetime value indirectly: every customer who churns before reaching that outcome never becomes a repeat or expansion customer.
So pin the metric to a named owner and a baseline. Track the median instead of the mean. Diagnose your own root driver instead of copying a generic tactic list. Do that, and you've got a number you can defend and a fix you can ship this quarter.
Frequently asked questions
What's the difference between time to value and time to market?
Time to market measures how fast a team ships a product; it's an internal engineering clock with no customer in it at all. Time to value starts only once a paying customer is in a position to benefit, so a product can hit its time-to-market date and still have a terrible TTV if onboarding is slow.
How long should it take a new user to reach their first value?
There's no single number: self-serve products should land in hours to days, mid-market B2B in a few weeks, enterprise rollouts in weeks to months. Whichever bracket applies to you, most of a product's eventual 90-day loss is already gone by day 30, which is the real argument for urgency over chasing a borrowed "golden window" figure.
Is "time to value" hyphenated?
Both forms are used. "Time to value" without hyphens is standard in running prose, while "time-to-value" appears mainly as a compound modifier before a noun, as in "a time-to-value metric."
What's the difference between time to value and user activation?
Activation is the specific action that signals a user found value. TTV is the duration it took to get there. Activation is the event; TTV is the clock that runs until that event happens.
How does a slow time to value affect customer lifetime value?
It compresses lifetime value indirectly, by increasing how many customers churn before they ever reach the value event that would have made them a repeat or expansion customer. A customer who never sees the win they signed up for never gets the chance to become a high-LTV one.
Figures and images in this post are free to reuse under CC BY 4.0 with credit to Mission Growth.
Get Mission Growth highlighted in your Google results.