Trial to Paid Conversion Rate: Formula, Benchmarks and Fixes
See the trial to paid conversion formula, real SaaS benchmarks by trial type, and why the ‘opt-out trials just convert better’ claim breaks down full-funnel.
On this page
Your trial to paid conversion rate looks fine on its own, until someone in the room asks whether it's actually good. A real comparison needs a number with a stated source behind it.
This guide uses FirstPageSage's own benchmark study of 86 SaaS companies for that comparison. It also runs a calculation the same data supports but nothing else in the search results actually performs.
Card-required trials convert a much higher share of trial users to paid. Multiply that share by how many people even start the trial, though, and card-free trials win on paying customers per visitor. How big that win is depends on which channel brought the visitor in.
In this guide:
- What actually counts as a trial signup, and a five-question checklist for the edge cases
- How to report a conversion rate on a fixed cadence instead of one early snapshot
- FirstPageSage's named benchmark numbers for opt-in, opt-out and freemium trials, organic traffic
- The full-funnel math that changes the card-required decision, and why it shifts on paid traffic
- Why some engaged trial users never convert, and the lever that actually fixes it
What counts as a trial, before you calculate anything
Trial-to-paid conversion rate is the share of a defined trial cohort that converts to a paying customer, measured against every user who started that cohort's trial.
A rolling snapshot of total signups is a different denominator. Mixing the two is where most reported rates go wrong.
Learning how to calculate trial to paid conversion rate takes one line of arithmetic, the easy half of this question. Naming which signups belong in the cohort is the harder half, and where most disputes start.
Trial to paid conversion rate = trial users who converted, divided by total trial users in the cohort, expressed as a percentage.
The dispute over a rate that "looks wrong" almost never lives in that formula. It lives in what belongs in the denominator in the first place.
Before you calculate anything, run every signup through five questions:
- Re-trial from the same company. A repeat trial from an account that already ran one this year belongs in its own cohort.
- Sales-extended access. Access a rep grants beyond the standard window is a sales decision, separate from self-serve signups.
- Multi-seat trials, one seat active. A five-seat trial with one active login counts as one engaged user.
- Promo-extended access. A promo-extended trial runs on a different clock than your standard cohort window.
- Internal or test accounts. Your team's test logins and QA accounts never belong in the denominator.
Most disputes over a conversion rate that looks wrong trace back to this list. The arithmetic is the easy part.
Getting this right matters beyond the board deck. It's the number that tells you whether a trial-length change, a pricing change or an onboarding fix actually moved conversions, or moved only which signups got counted.
How to measure it without lying to yourself
A trial to paid rate only means something once you name its cohort window and report it on a fixed cadence.
A snapshot taken too early always understates the true number.
The cohort discipline itself, tracking a group by shared start date rather than by calendar month, is the same methodology cohort analysis covers for retention curves in general. This section applies it specifically to trial conversion timing.
Report three numbers instead of one:
- Provisional, right when the trial ends. Useful for a first read, weak for a comparison.
- Billing-confirmed, one billing cycle later. The rate once early cancellations and failed cards have had a chance to drop out.
- Retained, one full quarter later. The only one of the three that's comparable across cohorts, because it's had enough time for both slow converters and early churners to show up.
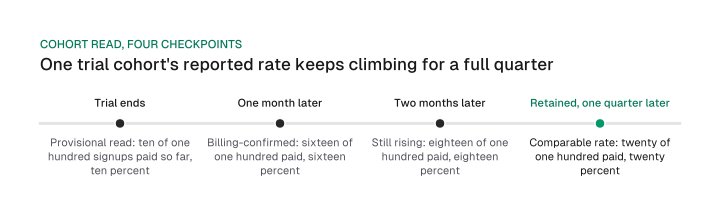
Picture one cohort of one hundred trial signups tracked at four checkpoints instead of one, for example. Right when the trial ends, ten of them have already paid, a provisional read of ten percent taken before any card has been charged twice.
A month later, once the first billing cycle clears and the failed cards and early cancellations drop out, sixteen have paid: a rate of sixteen percent. Two months in, it climbs to eighteen, or eighteen percent, as a few more accounts finish deciding.
By the retained checkpoint, a full quarter after the trial ended, twenty have paid, a rate of twenty percent and the cohort's final, comparable value, double the snapshot most teams report once and then stop tracking.
Compare a provisional read to a provisional read, and a retained read to a retained read. Mixing the two produces a comparison that means nothing, no matter how close the two percentages look side by side.
Before treating any metric as decision-grade, name its exact definition and cadence first. That's the same rule that decides how many SEO KPIs you should track.
What's a good trial to paid conversion rate for SaaS
On organic traffic, a trial to paid conversion rate of 18.2% is typical for card-free SaaS trials and 48.8% for card-required trials.
That range comes from the one benchmark study in this space that names its own sample and method.
FirstPageSage built this range from 86 SaaS companies, 71% B2B and 29% B2C, tracked from Q1 2022 through Q3 2025. What is a good trial conversion rate needs a stated source and a stated method behind it. A repeated blog range with no citation doesn't qualify, and these trial conversion rate benchmarks come with both.
One methodology detail changes how much weight the 48.8% figure deserves. FirstPageSage counts a trial as "converted" the moment a user retains even a single paid month. A customer who pays once and cancels counts the same as one who stays for years.
| Trial type | Visitor-to-trial (organic) | Trial-to-paid (organic) |
|---|---|---|
| Opt-in (no card) | 8.5% | 18.2% |
| Opt-out (card required) | 2.5% | 48.8% |
| Freemium | 13.3% | 2.6% |
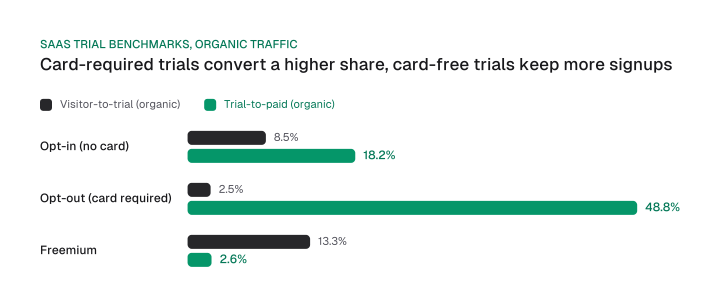
Freemium trails both on this measure: 2.6% of freemium signups become paying customers, in the same organic-traffic dataset. FirstPageSage's study is the most complete free trial to paid conversion rate dataset in this space, because it names both its sample and its method.
OpenView's 2022 Product Benchmarks survey reports a different number for the same idea: a median of 5% of freemium users convert to paid, self-reported across a broader survey of product-led-growth companies. The two numbers measure different funnels, though.
FirstPageSage's 2.6% covers organic-traffic signups only, pulled from agency client accounts across three and a half years. OpenView's 5% is a median across a broader survey, self-reported, and blended across every acquisition channel. Neither number is wrong. They answer different questions, and product-led-growth's reverse trial comparison runs the fuller freemium breakdown this section doesn't have room for.
This benchmark is trial-specific. The wider question of what counts as a good b2b conversion rate, across an entire funnel rather than just the trial stage, gets its own treatment separately.
Early-stage teams tightening this number should also check that their organic acquisition is pulling its own weight; SEO for early-stage startups covers where that effort pays off soonest.
Card-required vs. card-free: which lever actually wins
On organic traffic, card-required trials convert a higher share of trial users to paid.
But card-free trials convert more paying customers per visitor, because the card requirement also cuts signup volume by more than two-thirds.
The opt-in vs opt-out trial conversion comparison looks different depending on which funnel stage you check. Multiply the two stages FirstPageSage measures, visitor-to-trial and trial to paid, and you get visitor-to-paid: the number that actually tracks revenue per unit of traffic.
One analytics blog, Kissmetrics, has pointed out that a card-required trial pulls in far fewer total signups, so it doesn't automatically produce more paying customers than a card-free trial does. The post stops at that observation, though, and never runs the multiplication that would confirm it.
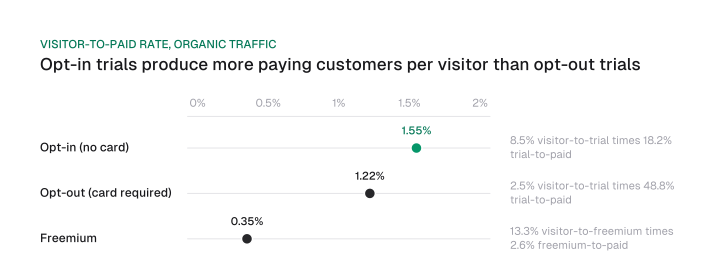
Multiplying FirstPageSage's own numbers confirms the direction. Opt-in's 8.5% visitor-to-trial figure times its 18.2% trial to paid figure gives a visitor-to-paid share of about 1.55%. Opt-out's 2.5% visitor-to-trial figure times its 48.8% trial to paid figure gives about 1.22%.
Opt-in's 1.55% clearly beats opt-out's 1.22% on this organic-traffic data, the gap that predicts revenue better than either trial-to-paid figure alone. Freemium trails both: 13.3% visitor-to-freemium times 2.6% freemium-to-paid works out to about 0.35% visitor-to-paid.
| Trial type (channel) | Visitor-to-trial | Trial-to-paid | Visitor-to-paid (derived) |
|---|---|---|---|
| Opt-in, organic | 8.5% | 18.2% | ≈1.55% |
| Opt-out, organic | 2.5% | 48.8% | ≈1.22% |
| Freemium, organic | 13.3% | 2.6% | ≈0.35% |
| Opt-in, paid traffic | 7.1% | 17.4% | ≈1.24% |
| Opt-out, paid traffic | 2.2% | 51% | ≈1.12% |
Download CSV (CC BY 4.0)
The gap narrows sharply once the acquisition channel switches from organic to paid search. FirstPageSage's paid-channel numbers put opt-in at 7.1% visitor-to-trial and 17.4% trial to paid, for a visitor-to-paid share of about 1.24%. The same source's opt-out figures, 2.2% and 51%, work out to about 1.12%. Opt-in still leads, but the margin over the alternative shrinks a lot compared with the organic numbers above.
Decide the card requirement on visitor-to-paid, the number that tracks revenue per unit of traffic, and check which channel actually brings in your trial signups before leaning on the organic-traffic version of this comparison. Once you've picked a trial type, run your own numbers through the LTV:CAC calculator to see how the visitor-to-paid difference compounds into revenue.
The levers inside the trial window
Trial users who never reach an activation event rarely convert, no matter how long the trial runs.
Fixing activation timing does more for the rate than a longer trial or another reminder email.
Engaged trial users who never convert get blamed on product-quality complaints or a nudge cadence that wasn't aggressive enough. A more consistent explanation is sequencing: a trial that ends before the user reaches the product's core activation event was going to fail regardless of what else happened inside it.
A few adjacent pieces round out the picture, each covered in more depth elsewhere:
- User activation covers the activation-event definition and formula itself.
- Time to value covers what actually shortens the path to that event, including feature gating and in-app nudges.
- Product qualified lead scoring turns trial behavior into a lead score sales can act on before the trial ends.
- Onboarding email sequences that time reminders around real usage, rather than a fixed day count, belong to that same activation-timing work.
Timing the upgrade prompt itself follows the same logic: fire it once the user has reached the activation event, not on a fixed day regardless of where they are in the product.
Test trial length and paywall placement on the same cadence as any other growth experiment, using growth experiment cadence to decide how long to run each test before reading the result.
None of this makes card-required trials the wrong choice, and it doesn't make card-free the automatic right one either. The choice should run on visitor-to-paid and on your own acquisition mix, not on the trial to paid number alone that most benchmark tables lead with.
Pull your own visitor-to-trial and trial to paid rates by channel this week. Multiply them the same way, and check whether your card-required trial actually wins on revenue per visitor or only on the stage everyone quotes.
Frequently asked questions
Why do some SaaS trial users never convert, even when they engaged with the product?
Most ran out of trial time before reaching the product's core activation event. The product itself usually isn't the problem: shortening or resequencing the path to that activation event, or timing when the trial ends around it, moves the rate more than a longer trial or another reminder email would.
Is a 10% conversion rate considered good?
It depends entirely on trial type. On a card-free SaaS trial, that figure sits well below FirstPageSage's 18.2% organic-traffic median, room to improve but not alarming on its own. On a card-required trial, where 48.8% is typical on the same data, that same figure is a warning sign worth investigating.
Should I require a credit card for my free trial?
Base the decision on visitor-to-paid, the full-funnel number, rather than trial to paid alone. On organic traffic, most SaaS products currently score higher on visitor-to-paid with a card-free trial; check your own numbers by channel before assuming that holds for paid traffic too.
How long should my free trial be?
Size it to how long a typical user needs to reach your product's core activation event. Time to value covers the specific drivers that shorten that path; a duration copied from someone else's published benchmark rarely fits your own product.
Figures and images in this post are free to reuse under CC BY 4.0 with credit to Mission Growth.
Get Mission Growth highlighted in your Google results.