Churn Prediction Models: Signals, Scoring, Evaluation
Churn prediction means picking a model by your data volume, defining a leak-proof label, and reading precision over accuracy when churn is rare.

On this page
A churn model succeeds or fails before anyone picks an algorithm. Three judgment calls decide the outcome: how the label gets defined without leaking the answer into it, which model actually fits the data on hand, and which metric to trust once churn turns rare inside the measurement window.
Get those three right and the specific algorithm becomes a minor detail. Get any one wrong, and a model that tops a leaderboard in testing will still miss the accounts that matter once it runs in production.
What churn prediction actually estimates
Churn prediction estimates which individual customers are likely to leave within a set window, expressed as a per-account risk score. That score is a different object from the aggregate rate a business reports for a quarter.
How the rate itself gets defined and benchmarked is a separate question, with its own formula and industry ranges.
Confusing the two is why "can AI predict churn" gets a vague answer almost everywhere. A model's accuracy is measured against the per-account label. That number says nothing on its own about the aggregate figure a board discusses: prediction scores one account at a time, and the rate simply summarizes what happened to all of them over a period.
The signals a churn model actually runs on
Customer churn signals fall into four families: behavioral and usage, billing and transaction, support interaction, and third-party intent data. The four differ sharply in how early they warn and how cheap they are to instrument, so the build order matters more than the grouping itself.
| Signal family | What it captures | Why it comes in this order |
|---|---|---|
| Behavioral / usage | Login frequency, feature adoption, seat activity | Already sits in product analytics and updates in real time, so it is the cheapest early warning to instrument first |
| Billing / transaction | Payment failures, downgrade requests, invoice disputes | Objective and hard to fake, but only refreshes on a billing cycle, so it lags behind behavior |
| Support interaction | Ticket volume, sentiment, escalation | A ticket is a reaction to a problem the customer already has, so it confirms risk instead of warning of it early |
| Third-party intent | Firmographic and intent data from outside vendors | The most expensive family to add, worth wiring up last once the first three are already flowing |
A team building its first model gets more from instrumenting behavioral data cleanly than from adding a fourth source before the first three are reliable. Feature engineering matters here too: a raw login count is weaker than one normalized against that account's own baseline, since team size changes what "active" means.
Two constraints sit underneath all four families. Usage, billing and support data often live in three separate systems that need a shared account key before any model can join them.
Support tickets and behavioral logs can also carry personal data, so the feature pipeline needs the same access controls as the source systems it draws from. That includes a defined retention window for the churn-risk features themselves and a limit on who inside the company can see one account's score.
Choosing a model by how much data you have, not by how sophisticated it sounds
Five rungs decide which churn prediction model actually fits, ordered by how much labeled history each needs: a rules-based score requires none, a manually weighted health score needs only domain judgment, logistic regression needs a few hundred labeled events, and a tree ensemble or survival model earns its complexity only once thousands exist.
Building a churn prediction model is a data-inventory question first, an algorithm choice second.
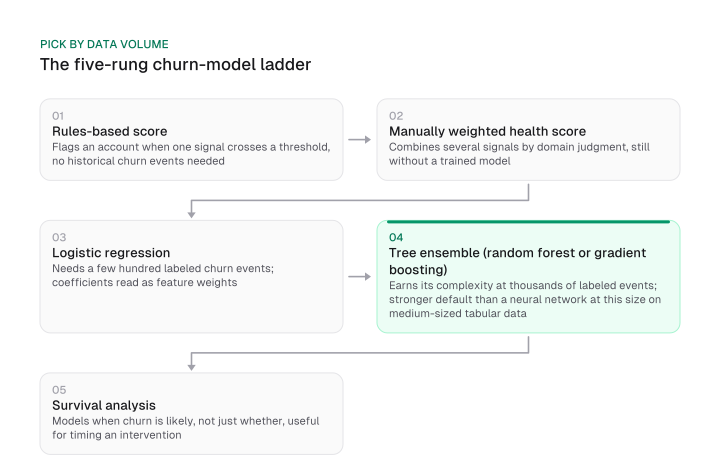
The bottom two rungs need no trained model. A rules-based score flags an account the moment one signal crosses a threshold, such as a login gap past a set number of days. A manually weighted health score is one step up: several signals combined into a single number by judgment, still without any historical events to train on.
Churn prediction using machine learning starts at the third rung. Logistic regression needs surprisingly little history, a few hundred labeled events, and its coefficients map directly to feature weights a non-technical stakeholder can read and check.
A tree ensemble, random forest or gradient boosting such as XGBoost, is the rung most teams reach once volume supports it. Compared with a neural network, it is the stronger default at this size: Grinsztajn, Oyallon and Varoquaux's NeurIPS 2022 benchmark tested 45 tabular datasets and found tree-based models still outperform neural networks on medium-sized data, around 10,000 rows, the size band most SaaS datasets actually sit in.
A neural network needs substantially more labeled history to earn its extra complexity, and it trades away the interpretability a tree ensemble still partly keeps through feature importances.
The top rung, survival analysis, answers a different question: it models when an account is likely to leave rather than only whether it will, which is what makes it useful for timing an intervention. It outputs a curve of risk over time for each account, so a team can prioritize the ones approaching their own highest-risk window instead of treating every flagged account the same.
The same data-matching logic used in SEO forecasting applies here too: the model a team can trust stays capped by how much clean history it has on hand. There is no single best churn prediction model: the right one is whichever rung matches that history.
Defining the label without leaking the answer into it
A label leaks whenever a feature is illegitimate: information that could only exist because the customer had already churned. Kaufman, Rosset, Perlich and Stitelman set out that formal legitimacy test in their 2012 ACM paper on data-mining leakage, and it turns a vague warning into three traps a data team can check one by one before training starts.
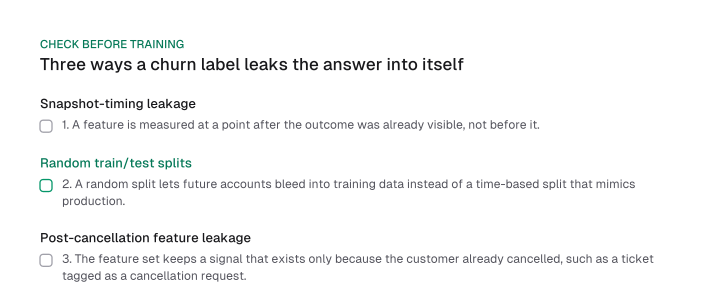
The first trap is snapshot-timing leakage. A feature gets measured at a point after the outcome was already visible, so the model quietly reads the answer off a value that only looks like a predictor.
The second trap is a random train and test split instead of a time-based one. A random split lets future accounts bleed into training data, which flatters test-set performance in a way a production pipeline can never replicate.
Production only ever sees the past, never a random sample of the future, so the split used in training has to mimic that constraint.
The third trap is a feature set that keeps a signal which exists only because the customer already cancelled, such as a support ticket tagged as a cancellation request sitting in the same table as the behavioral features.
Any one of these three traps is enough to produce a model that looks excellent in testing and falls apart the first month it runs live. Checking a label against all three before training is what catches that gap early.
A worked example: turning a model into a score someone can act on
A logistic regression's raw coefficients convert into a single risk score a customer-success rep can compute by hand from five inputs, without needing to see the underlying model. This example is illustrative, built to show the mechanism, and it does not use a real customer dataset.
| Input | What it captures | Weight in the score |
|---|---|---|
| Weekly logins | Recent usage trend | Heaviest |
| Seat utilization | Share of purchased seats actually active | Heaviest |
| Recent support tickets | Friction signal | Moderate |
| Days since admin last logged in | Champion disengagement | Moderate |
| Plan tier | Switching cost | Lightest |
Each input contributes a share of one normalized score, weighted by how strongly the model's fitted coefficients say it moves the odds of churn. A rep sums the five weighted contributions and reads one score directly, without opening the model or trusting an unexplained output.
Picture an account with strong weekly logins and high seat utilization but a long gap since the admin last signed in: the two heaviest-weighted inputs pull the score down, the lagging admin signal pulls it back up, and the rep sees a middling score that names exactly which input to check first.
The translation step from "we trained a model" to "someone uses the score" is where this mechanism earns its keep, and it works the same way regardless of which specific coefficients a team's own data produces.
Reading the score when churn is rare
A precision-recall curve reads more honestly than ROC-AUC when churn affects only a small share of customers in the window measured, since ROC-AUC can look strong on a model that catches almost none of the real churners.
Saito and Rehmsmeier demonstrated this directly in their 2015 PLOS ONE study: on an imbalanced dataset, a model can post a high ROC-AUC score while its precision-recall curve exposes it as barely better than guessing on the minority class.
Churn is exactly this kind of imbalanced problem. In most SaaS accounts, the customers who leave in any given month are a small fraction of the base rather than half of it. A model evaluated on overall accuracy can score well simply by predicting no departure for everyone, since that is the majority outcome.
ROC-AUC is often named as the fix for accuracy's blind spot under imbalance, and it carries a version of the same blind spot itself. Saito and Rehmsmeier's finding is that ROC-AUC stays overly optimistic under the same conditions, while a precision-recall curve shows exactly how many flagged accounts were real churners and how many real churners the model missed.
Mission Growth's piece on AI search visibility KPIs runs into the same denominator problem behind AI search visibility KPIs. A headline percentage can hide what it is actually dividing by, and a churn score deserves the same scrutiny before anyone trusts it.
Operationalising the score: playbooks, prioritisation and when to retrain
Knowing how to create a churn prediction strategy that survives production comes down to one habit: retraining on a fixed, measured trigger.
A calendar reminder to retrain periodically carries no metric attached to it, so nobody actually knows when confidence has decayed.
A concrete trigger combines two pieces that usually get stated separately: watching precision specifically at the top decile of risk scores, the accounts the team actually acts on, and setting a fixed threshold for how far that number can fall from its launch value before retraining is scheduled. Once precision at the top decile drops past that threshold, the team retrains instead of guessing whether last quarter's model still holds.
That same discipline shows up elsewhere too: content decay detection also confirms a drop with a second signal before anyone treats it as real.
For teams also reading retention curves alongside a point-in-time score, reading the retention curve itself is the companion piece to the survival-analysis rung above, covering the time-to-event view this guide only introduces.
Frequently asked questions
How do I know my churn labels are leaking before I ship the model?
Run the label against the three traps above: check whether any feature could only be known after the churn date, confirm the train and test split is time-based rather than random, and scan the feature set for anything tied to cancellation itself.
When is a rules-based health score good enough, and when do I actually need a model?
The bottom rung of the ladder needs no historical churn events at all. Move up to logistic regression once a few hundred labeled events exist and a stakeholder wants a score that reads as more than a fixed threshold.
How do I turn a churn score into something a team will actually act on?
Convert the model's coefficients into a weighted score like the worked example above, and pair it with a retrain trigger tied to a specific metric, precision at the top decile, rather than a calendar reminder.
What's the difference between churn prediction and churn rate?
Churn prediction scores individual accounts before they leave. Churn rate summarizes what already happened across the whole base for a period; how it is defined and benchmarked is covered in Mission Growth's churn-reduction piece.
Can AI predict churn accurately?
It depends on which metric is doing the measuring rather than on a single accuracy figure. A model can post strong overall accuracy or ROC-AUC and still miss most real churners when churn is rare, so precision and recall at the decile a team actually acts on show what the model really caught.
Picking a model by data volume, writing a label that can't leak, and reading the right metric under imbalance are the three calls that decide whether a churn model works. Start by auditing which rung of the ladder your own labeled history actually supports before a data team writes a single line of model code.
Figures and images in this post are free to reuse under CC BY 4.0 with credit to Mission Growth.
Get Mission Growth highlighted in your Google results.