Churn Reduction: How to Reduce Customer Churn
Most churn reduction guides list ten generic tactics. This one diagnoses voluntary vs. involuntary churn, so you fix what is actually costing revenue.

On this page
Most customer churn reduction strategies read like the same checklist copied ten times: improve onboarding, add loyalty perks, respond to support tickets faster, watch your NPS. None of them tell you which item to run first, and running the wrong one first is how a quarter of retention budget gets spent on a problem you don't actually have.
This guide answers how to reduce churn differently: diagnose the type of churn first, then pick the tactic that actually matches it. It's one part of the broader growth marketing toolkit, which works the same way: diagnose before you spend.
What churn reduction means (and the two kinds of churn that need different fixes)
Churn reduction is the set of tactics that lower the rate customers cancel or fail to renew. The right tactic depends on one distinction: voluntary vs involuntary churn. Voluntary means an active decision to leave; involuntary means a failed payment that never became a decision at all.
Onboarding, value delivery and customer success address the voluntary side. Payment recovery and dunning address the involuntary side. A tactic aimed at the wrong type does close to nothing, which is why a plan that skips this diagnosis and jumps straight to a tactics list usually stalls.
Splitting voluntary from involuntary churn isn't new. What's usually missing from advice on how to reduce customer churn is a rule for which side to fix first, plus a real number showing what fixing it is worth. That's what the rest of this guide adds.
Churn rate vs. attrition rate. Churn measures the rate customers leave over a defined period, expressed as a percentage. Attrition is often used more loosely, for cumulative cohort loss or headcount reduction, and vendor content tends to use the two interchangeably. That's why your churn dashboard and someone else's "attrition rate" rarely mean the same thing.
Calculate your churn rate, then benchmark it against the right group, not an average
Churn rate is the number of customers lost during a period, divided by your active customer count when that period began, then multiplied by 100. That's the standard churn rate formula, a headcount calculation rather than a revenue one. To reduce customer churn rate in a way that actually moves the needle, compare your number to the right group instead of a single flat industry average.
In Recurly's July 2026 network data, software businesses churn at a median of 3.04% a year, with top-quartile performers at 1.78% or below. That's a more current number than the flat, several-years-old averages still cited across this topic, but it flattens a gap that matters more than the headline figure.
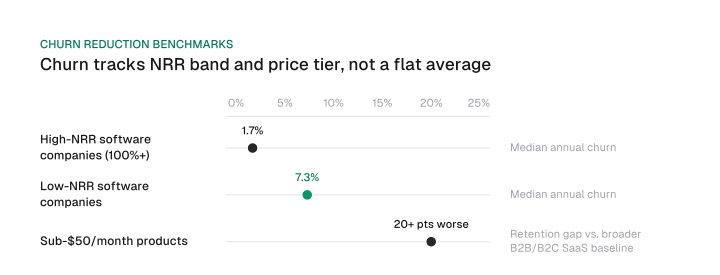
A December 2025 ChartMogul analysis of 3,500 software companies found that churn tracks net revenue retention (NRR) band far more than "industry." Companies in the low-NRR range had a median annual churn of 7.3%, versus 1.7% for companies at or above 100% NRR: a more than fourfold gap between two groups that would otherwise both get labeled "SaaS."
Price point moves the number too. The same ChartMogul analysis found that products priced under $50 a month retain 20 or more percentage points worse than the broader B2B/B2C SaaS baseline, while products above $250 a month retain in line with that same baseline. A cheap, high-volume product and an enterprise contract are not the same retention problem, even when the tactics list looks identical.
| Segment | Median annual churn | Source |
|---|---|---|
| All software businesses | 3.04% (top quartile 1.78% or below) | Recurly network data, July 2026 |
| Low-NRR software companies | 7.3% | ChartMogul analysis, Dec 2025 (n=3,500) |
| High-NRR software companies (100%+) | 1.7% | ChartMogul analysis, Dec 2025 (n=3,500) |
Download CSV (CC BY 4.0)
To run your own numbers before comparing them with the table above, Mission Growth's free LTV:CAC calculator works out monthly or annual churn alongside CAC and LTV. Reading the shape of your own retention curve over time, rather than a single-period rate, is a separate skill worth reading retention curves with cohort analysis.
Diagnose which churn you actually have before choosing a fix
Voluntary and involuntary churn need different fixes, so logo churn has to be split between the two before you run any tactic. A payment-recovery fix does nothing for a customer who canceled by choice, and an onboarding fix does nothing for a customer whose card just expired.
Here's a checkable rule for where to look first, instead of guessing. Recurly's July 2026 network data gives SaaS a 3.22% total churn rate, 1.06 points of it involuntary, so payment failures make up about a third of SaaS churn. Pull your own logo churn apart by cause and compare your payment-failure share to that SaaS third.
Run noticeably above a third, and this quarter's budget belongs on payment recovery before onboarding or customer-success spend. Run below it, and the reverse holds: your churn is mostly a decision problem rather than a billing one, so voluntary-churn fixes carry more weight.
This diagnostic step also sets up a separate question worth asking on its own: which specific customers are most likely to churn next, the territory of predicting which customers will churn.
Stripe's network-wide data is the cross-industry reference: payment failures cause about a quarter of all lapsed subscriptions. The two numbers answer different questions. A SaaS business sitting exactly at Recurly's SaaS median is already above Stripe's quarter without anything being wrong, so weigh your split against the SaaS third and treat Stripe's figure as context.
Fix involuntary churn first if it's inflating your number: payment recovery and dunning
Involuntary churn responds fastest to automated, individually timed retries and dunning, because it isn't a decision at all. Stripe's own engineering team built Smart Retries to solve exactly this: rather than retrying a failed card on a fixed schedule, the system predicts the optimal retry time for each failed payment using machine learning trained on billions of data points and signals like the decline code.
In a January 2024 write-up, Stripe reported that 25% of lapsed subscriptions are purely due to payment failures, and that subscriptions recovered through a successful retry continue for an average of seven more months afterward.
A practical payment-recovery stack looks like this:
- Smart, staggered retries. Time retry attempts to the specific decline code and failure reason rather than a blanket "retry every three days" schedule; a card declined for insufficient funds behaves differently than one declined for an expired date.
- Dunning emails that give the customer something to do. Tell the customer exactly what failed and link straight to an update-card page, rather than a generic "your payment didn't go through."
- A card updater. Many card networks push updated card numbers and expiration dates automatically when a customer's bank reissues a card, closing the gap before a retry is even needed.
- A short grace period. Keep access live for a few days past the failed charge instead of an immediate, hard cutoff, so the customer has a chance to fix the payment method before they've already mentally moved on.
None of these tactics require guessing at the customer's intent, because there wasn't one. The fix is mechanical, and Stripe's data suggests it recovers a meaningful share of what looks like churn but isn't.
Fix voluntary churn: onboarding, time-to-value and proactive customer success
Voluntary churn falls when customers reach value fast and get proactive help before they consider leaving, and for "nice-to-have" products it only falls when you prove a fresh, visible win every billing cycle, well beyond signup.
Onboarding and reducing time to value sit at the root of most voluntary churn: a customer who never reaches a first real win has no reason to renew, regardless of how good the product eventually becomes. That connects directly to user activation, the measurable moment a new customer gets that first win, which is a different question from onboarding design itself.
Beyond onboarding, the tactics that show up across this topic, in rough order of what the evidence supports:
- Proactive customer success and health scoring. Reach out before a customer shows obvious risk signals, rather than after a support ticket or a downgrade request.
- Investing in customer support. Faster, more competent responses reduce the frustration that turns into a cancellation, particularly for smaller accounts that don't have a dedicated success manager.
- Closing the loop on feedback. Ask, then visibly act on what customers tell you. Vendor-published numbers on exactly how much this moves retention vary by methodology and source, so treat any specific percentage from a single vendor's own report as that vendor's claim alone.
- Flexible pricing and plans. A plan that flexes with a customer's usage removes one common reason for a purely economic cancellation.
- Communicating roadmap and changes. Customers who see a product actively improving are less likely to assume it's been abandoned.
- Rewarding loyalty. Discounts, perks or recognition for long tenure give customers one more reason to stay past a renewal decision point.
- Long-term contracts. An annual or multi-year term, often priced with a discount for committing upfront, cuts the number of renewal decision points where a customer could walk away, even though it doesn't fix the underlying reason they'd want to.
For "nice-to-have" products, the ones a customer's workflow doesn't strictly require, this list needs one addition: show a new, visible result every billing cycle, well past onboarding. A nice-to-have tool is the first line item cut when a budget tightens, and a customer who can't point to something the product did for them this month has already mentally filed it under "we could live without this."
That's a different challenge from a budget-constrained buyer's decision at signup, which is closer to SEO for early-stage startups territory: proving value on a tight budget from day one and keeping it visible well after.
Some churn discussion now frames AI tools as a new pressure on retention: the logic is that when an AI feature can replicate what a product does, customers leave faster. That claim traces to a single unsourced quote in one article rather than a verified pattern, so it belongs here only as a caveat, not a section on its own.
The case for taking any of this seriously isn't hypothetical. Reichheld and Sasser's original 1990 Harvard Business Review article, "Zero Defections: Quality Comes to Services," later republished by Bain & Company, is the authors' own case study rather than a Bain proprietary finding.
It documents what MBNA did with its credit-card business: cut its customer defection rate to about 5%, roughly half the industry average at the time, while profit grew sixteenfold and its position in the industry ranking moved from 38th to 4th. That's the specific, checkable version of the retention argument.
Retention economics like this also change the return on acquisition spend: a customer who sticks around longer makes every dollar you put into SaaS SEO strategy worth more, because the same acquired customer now pays back over a longer window.
Handle the customers who are already leaving: cancellation flow and save offers
The right save offer depends on why the customer is leaving. A discount fits a price objection. A plan pause fits a temporary budget cut. Letting a non-ICP account go is often the healthier call than paying to keep it, since an account that was never a fit tends to churn again anyway or consumes support time out of proportion to its revenue.
| Reason for leaving | Response |
|---|---|
| Price objection | Discount or a lower-tier plan |
| Temporary budget cut | Plan pause, not a permanent downgrade |
| Not a fit for the product (non-ICP) | Let the account go rather than paying to retain it |
The general idea of matching a save offer to a reason, instead of a blanket discount, already appears across this topic. What's usually missing is this specific mapping: which offer fits which reason, tied back to the "healthy churn" idea that not every canceling account is worth fighting to keep.
A full cancellation-flow design, the actual screens, timing and copy of the flow itself, is a deeper topic on its own. This section stops at the decision rule.
What a churn-rate change is actually worth: a worked example
A 2-point drop in monthly churn changes both how long a customer sticks around and how much you can afford to spend acquiring the next one, and running the numbers on one example makes that concrete instead of directional.
ChartMogul's simple LTV formula is: LTV = ARPA x Gross Margin / Churn Rate. Take an illustrative SaaS business with $500 in average revenue per account (ARPA) per month and an 80% gross margin.
At 5% monthly churn, LTV comes out to $8,000. Drop monthly churn to 3%, holding ARPA and margin constant, and LTV rises to $13,333, a 67% increase, because the same customer now sticks around proportionally longer before churning.
That LTV increase changes what you can justify spending to acquire the next customer. Against an illustrative $4,000 customer acquisition cost (CAC), the LTV:CAC ratio moves from 2:1 at 5% churn to 3.33:1 at 3% churn, crossing the 3:1 ratio commonly cited as a healthy benchmark (4:1 or better is considered great).
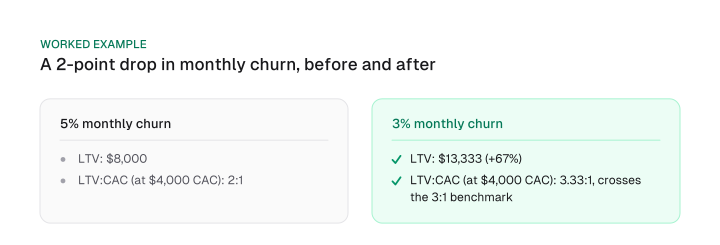
| 5% monthly churn | 3% monthly churn | |
|---|---|---|
| LTV | $8,000 | $13,333 (+67%) |
| LTV:CAC (at $4,000 CAC) | 2:1 | 3.33:1 |
The ARPA, margin and CAC here are illustrative inputs meant to show the mechanism. Run your own numbers with your actual ARPA, gross margin and CAC to see where a similar churn improvement would move your own LTV:CAC ratio.
Splitting churn into voluntary and involuntary isn't the novel part of this guide. The novel part is a threshold you can check your own numbers against, Stripe's roughly one-in-four payment-failure share, plus a dollar calculation you can rerun with your own inputs.
Start there: pull your logo churn apart by cause, compare your payment-failure share to the SaaS benchmark of about a third, and run the LTV math on whatever fix you pick first.
Frequently asked questions
What is churn vs. attrition?
Churn measures the rate customers leave over a defined period. Attrition is often used more loosely, for cumulative cohort loss or headcount reduction. The two get used interchangeably in vendor content, which is why your churn dashboard and someone else's "attrition rate" rarely mean the same thing.
How do you reduce churn for "nice-to-have" SaaS products?
Show a concrete, new result every billing cycle, well after signup, because these tools are the first line item cut when budgets tighten. A win from three months ago doesn't help a customer decide whether to keep paying this month.
What does a 5% or 20% churn rate mean?
It depends entirely on the period. Annually, Recurly's July 2026 network data puts the median for software businesses at 3.04% (top-quartile performers at 1.78% or below), so 5% a year is already above the segment median and 20% a year is well outside it. Monthly is a different story: monthly churn compounds over a year, so a 5% monthly figure is not the same problem as 5% annually, and 20% a month would be alarming for almost any subscription business. The period is often the detail left out.
What does my churn rate actually tell me?
On its own, the number says little. What it means depends on your NRR band and your price point, which is why the benchmark table above matters more than the raw figure.
What actually works to reduce churn, according to people who do this for a living?
The diagnosis-first approach in this guide, splitting voluntary from involuntary churn and fixing the higher-impact one first, mirrors how practitioner discussions about churn tend to frame it: not a single tactic, but knowing which tactic applies to your specific churn.
Figures and images in this post are free to reuse under CC BY 4.0 with credit to Mission Growth.
Get Mission Growth highlighted in your Google results.