MMM vs MTA Cost and the Decision Table That Settles It
MMM vs MTA measure different things. See the five real differences, a decision table for which to run first, and when incrementality testing should referee.

On this page
MMM vs MTA is a question of what each one measures, not which one is more "true." Marketing mix modeling estimates a channel's contribution to sales from aggregate, top-down time-series data. Multi-touch attribution splits conversion credit across one tracked user's touchpoints from bottom-up, event-level data.
Everyone agrees on that much and then stops at "it depends." Four measurable thresholds decide which method to run first instead, and when the two outputs disagree, a geo or holdout incrementality test is the mechanical check that settles it.
MMM vs MTA: what each one measures
An mmm attribution model and an mta attribution model start from different data and are built to answer different questions.
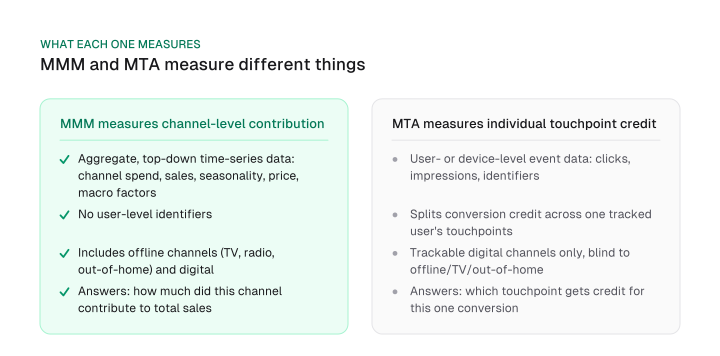
MMM works from aggregate time-series data: channel spend, total sales, and external factors like seasonality, price changes, and macro conditions. It has no user-level identifiers to work with, which is exactly what lets it see offline media (TV, radio, out-of-home) alongside digital. It answers "how much did this channel contribute to total sales over this period."
MTA works from user- or device-level event data: clicks, impressions, and identifiers tied to one person's path to conversion. It answers a narrower, faster question: "which touchpoint in this one conversion gets the credit." That's also its ceiling: MTA sees the digital channels it can tag, so TV, radio, and most out-of-home spend never enter its model at all.
One MTA question rarely gets a straight answer: what separates single-source (or single-touch) attribution from multi-touch attribution? The common weighting types, linear, time-decay, U-shaped (position-based), W-shaped, and algorithmic, describe splitting credit across touchpoints; none of them name the simplest rule, the one most people mean when they first ask about attribution.
Single-source, or single-touch, attribution (last-touch is the most common version) gives all of the conversion credit to one interaction, usually the last click before the sale. It's the simplest weighting rule, the one the types above were built to replace. Some vendors group it inside multi-touch attribution's toolkit; strictly, multi-touch means crediting more than one touch, so single-touch sits just outside that definition even where a vendor's list includes it.
The same last-click undercounting shows up at a narrower scale too. SEO's own version of this problem, where a single search touchpoint gets undercounted against later-funnel clicks, is a channel-level instance of the same measurement choice at the whole-business level. See seo attribution for that channel-specific case.
The five differences that decide which one fits
The marketing mix modeling vs multi-touch attribution comparison comes down to five practical axes: data type, granularity, channel scope, time horizon, and privacy exposure.
Each axis points a different kind of business toward a different method.
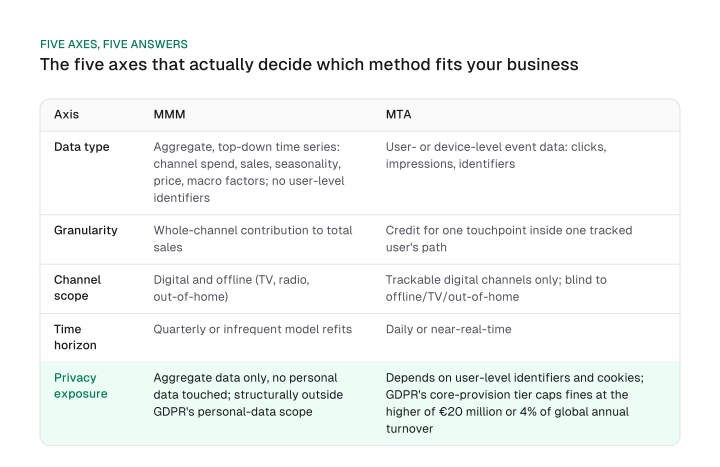
| Axis | MMM | MTA |
|---|---|---|
| Data type | Aggregate, top-down time series: channel spend, sales, seasonality, price, macro factors; no user-level identifiers | User- or device-level event data: clicks, impressions, identifiers |
| Granularity | Whole-channel contribution to total sales | Credit for one touchpoint inside one tracked user's path |
| Channel scope | Digital and offline (TV, radio, out-of-home) | Trackable digital channels only; blind to offline/TV/out-of-home |
| Time horizon | Quarterly or infrequent model refits | Daily or near-real-time |
| Privacy exposure | Aggregate data only, no personal data touched; structurally outside GDPR's personal-data scope | Depends on user-level identifiers and cookies; GDPR's core-provision tier caps fines at the higher of €20 million or 4% of global annual turnover |
Download CSV (CC BY 4.0)
Two of those rows need more than a table cell. The first is the channel-scope row's mechanism: why MMM can even see what it sees. MMM's regression doesn't just correlate spend with sales, it runs two named transformations on every channel first.
An Adstock decay function models carryover: the fact that this week's TV ad still drives some sales next week, captured with a decay parameter α using geometric or binomial weighting.
A Hill saturation function models diminishing returns: the fact that the tenth dollar of weekly spend on a channel buys less incremental sales than the first. The formula is Hill(x; ec, slope), where ec is the half-saturation spend level. Both transformations run together because advertising has a persistence effect and a diminishing-returns effect that are mathematically distinct, according to Google's own Meridian model-spec docs.
The second is the privacy row. MTA's dependence on identifiers and cookies puts it inside GDPR's personal-data scope in a way MMM's aggregate inputs never are. The ceiling that illustrates that exposure is GDPR Article 83(5): the core-provision infringement tier, which covers unlawful processing of personal data. It caps administrative fines at up to €20 million or 4% of total worldwide annual turnover, whichever is higher, per the official EUR-Lex regulation text.
That ceiling illustrates exposure; most MTA programs will never pay anywhere near it. It's the reason legal and privacy teams get a seat at the table when a company scales its tracking stack, a seat they rarely get for an MMM build.
The same partial-answer pattern shows up one level down, inside a single channel: see content ROI for the attribution models GA4 itself offers for content specifically, where they stop short of the whole-business view.
The decision table: when to run MMM, when to run MTA
Four situational factors decide the choice between MMM and MTA: channel mix breadth, spend scale and data history, tracking-signal availability, and how fast you need an answer.
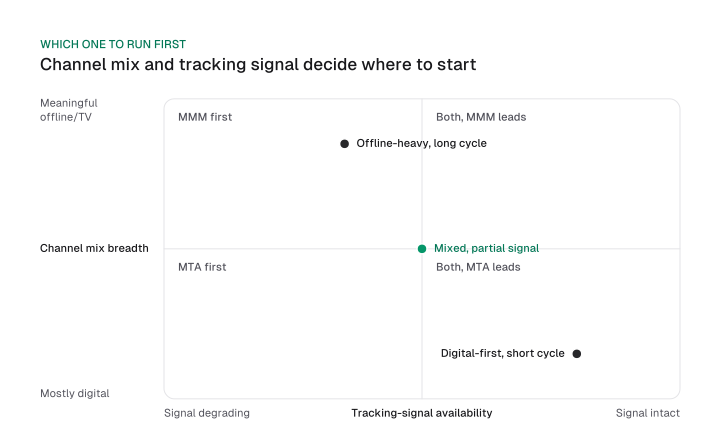
| Business situation | Channel mix | Data history | Tracking signal | Decision speed needed | Start with | Calibration check |
|---|---|---|---|---|---|---|
| Digital-first, short sales cycle (DTC e-commerce, no TV/offline spend) | Mostly digital | Any | Mostly intact | Daily or weekly optimization | MTA | Geo holdout on the top MTA-credited channel |
| Offline-heavy, long consideration cycle (enterprise B2B, CPG with TV/OOH) | Meaningful offline/TV spend | 2+ years of clean weekly data | Degrading or less relevant to the decision | Quarterly budget planning | MMM | Incrementality test on the largest channel to validate model coefficients |
| Mixed digital and offline, uncertain tracking | Mixed | Under 2 years, or incomplete | Partially degrading (iOS ATT, cookie deprecation) | Both cadences needed | Both, MTA first while building MMM's data history | Holdout test on the highest-spend channel to reconcile the two outputs |
Download CSV (CC BY 4.0)
Most businesses that land on "it depends" after a five-bullet comparison are actually in that third row: mixed channels, tracking signal that's degrading but not gone, and a data history too short to trust a full MMM model yet.
The table's answer for that row is concrete: run MTA now for the daily view, start collecting the clean weekly spend-and-sales history MMM needs, and use a holdout test as the interim check on whichever channel gets the most argued-about credit. The mmm vs mta examples in the three rows above are named business situations, each mapped to a recommendation.
That third row also answers "is MTA dead?" MTA is degrading as third-party tracking signal erodes, but it still answers a question MMM structurally can't: which specific digital touchpoint drove this week's conversion. Single-touch/last-touch attribution and incrementality testing both exist as narrower alternatives to running full MMM or full MTA; the mechanics of the latter, holdout and geo test design, belong to incrementality testing.
Do you need $2 million in ad spend to run MMM?
Marketing mix modeling has no fixed ad-spend floor.
Meta's own Robyn documentation sets the real bar at data history. Google's Meridian documentation frames readiness the same way, as data points per modeled parameter.
observix.ai states a spend floor directly:
"Experts say marketing mix modeling usually needs around $2 million in annual ad spend to be reliable."
That figure is attributed to unnamed "experts" and softened later in the same article's FAQ section, and it's the only spend floor stated anywhere in guides covering this topic. It also isn't what either vendor that publishes MMM software actually says.
Meta's Robyn documentation states a minimum of two years of historical weekly data for a reliable model; when only monthly data is available, four to five years is the stated recommendation instead. Google's Meridian documentation frames readiness the same way, as a ratio rather than a spend number:
- National models: roughly 15 data points per parameter is a workable target; 4 per parameter is called "too low to estimate the model reliably."
- Geo models: the ratio falls between about 8 (strict) and about 74 (lenient), depending on partial pooling across regions.
None of that is a spend number. Data history and how many channels and controls you're modeling decide MMM readiness.
Combining MMM and MTA, and where incrementality testing referees
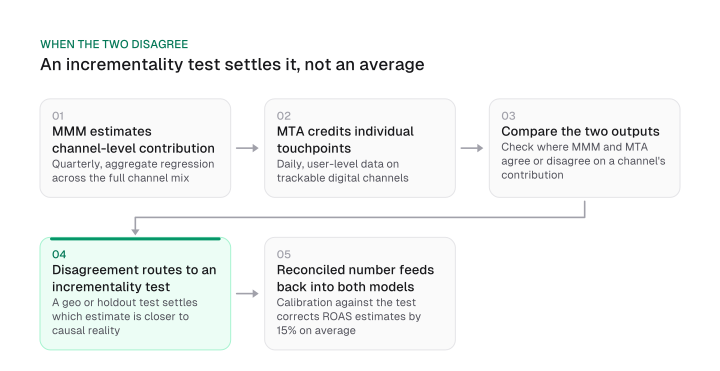
Combining MMM and MTA works because each corrects the other's blind spot, and incrementality testing is the calibration step that settles it when the two disagree. Designing an accurate hybrid MMM/MTA model means running that combination as a six-step loop, not a one-time integration project:
- MMM sets channel-level budget on the weekly history it needs.
- MTA steers in-channel, daily optimization where tracking holds.
- Compare the two channel contributions.
- Where they disagree, run a geo or holdout incrementality test.
- Use the test result to calibrate the model you trust less.
- Re-run on a fixed cadence.
An accurate hybrid isn't a one-time alignment between the two models; it's this loop, repeated on a fixed cadence so the calibration doesn't go stale as tracking signal keeps degrading.
What that combination catches shows up concretely in Nielsen's own 2022 ROI report: social media returned 1.7x the ROI of TV while receiving less than one-third of TV's ad budget, one channel-level reallocation opportunity inside a broader finding that 50% of media plans were underinvested by a median of 50%, what Nielsen called the "50-50-50 gap."
A channel comparison like that needs visibility into TV spend in the first place. That's precisely what MMM's whole-channel-mix regression has, and what MTA structurally cannot see, because MTA has no view into TV at all.
Operationally, the two run on different clocks: MMM refits quarterly against fresh spend and sales history, while MTA updates continuously as tracking data streams in. A hybrid setup, aligning the two models' inputs and reporting them on a shared cadence, is a real architecture pattern, but it's a consulting exercise beyond this comparison's scope.
The reconciliation step is where a widely repeated calibration figure gets mis-scoped. funnel.io states it this way:
"A case study from Harvard Business Review shows that using calibration with MMM studies can make the models up to 15% more accurate."
The actual HBR article states something narrower. Meta's own Marketing Science team published the piece on 2023-03-24, and it reports that calibrating MMM against ad experiments corrected MMM-based return-on-ad-spend estimates by 15% on average, across 18 app-advertiser case studies in North America and Europe.
Other industry reports the same article cites found an average 25% correction across a wider set of verticals, including FMCG, home appliances, telecom, real estate, and automotive, spanning APAC, the US, Brazil, Russia, and South Africa.
That's an average correction to one metric, return on ad spend, and it's not a ceiling on MMM's general accuracy. Calibrating against an ad experiment is itself a form of incrementality testing: a geo or holdout result feeding back into the model as ground truth.
This is the mmm vs mta vs incrementality triangulation in practice: MMM sets the budget-level view, MTA sets the daily channel-level view, and when the two disagree on a channel's contribution, a geo or holdout incrementality test, rather than an average of the two numbers, is the causal check that decides which one to trust.
The toolkit for designing that check, minimum detectable effect and sequential testing, belongs to a different piece; this comparison is about knowing when to reach for it.
Sample ratio mismatch is the third tool in that same toolkit, a check for whether the test itself ran cleanly before its result gets trusted. The same unattributed-revenue question scales down to a single KPI dashboard too: see SEO KPIs for what to do when a channel's numbers still don't add up.
Which method to run first was never a philosophical stance on which one is "more true." Score your own business against the four thresholds above, channel mix breadth, data history, tracking-signal health, and how fast you need an answer, then pick the row that matches.
If MMM and MTA still disagree once both are running, treat that disagreement as a prompt: run the calibration test against the table instead of picking a side by instinct.
Frequently asked questions
What's the difference between single-source attribution and multi-touch attribution?
Single-source attribution, also called single-touch or last-touch, gives all of the conversion credit to one interaction. Multi-touch attribution splits that credit across every touchpoint in the path. Single-touch is one specific weighting rule inside the broader MTA category, rather than a separate method.
Are MTA and MMM the only options?
No. Single-touch attribution and incrementality testing (holdout or geo tests) are both narrower alternatives. Incrementality testing measures causal lift directly rather than modeling contribution or crediting touchpoints; the incrementality-testing guide above covers how that test design actually works.
Is MTA dead, or is MMM replacing it?
Neither. MTA is degrading as third-party tracking signal erodes, but it still answers a question MMM structurally can't: which specific digital touchpoint drove a given conversion this week. The two solve different problems, and a business rarely retires one by adopting the other.
What does MMM mean in business, in one line?
Marketing mix modeling is a statistical model that estimates each marketing channel's contribution to sales using aggregate spend and sales history, rather than tracking individual users.
Do I need a data science team to run either one?
MTA needs solid tracking and tagging implementation more than statistical expertise. MMM needs a statistician, or an analyst comfortable running an open-source package like Meridian or Robyn, plus the two-plus years of clean weekly data both vendors' own documentation calls for. Neither is a weekend project.
How much do MMM and MTA actually cost?
The mmm vs mta cost question really has two answers: software licensing is free either way, and the real cost is in people and data. Meridian (Google) and Robyn (Meta) are both open-source and free to run. MMM needs an analyst who can run and interpret a Bayesian model, plus the two years of clean weekly history to feed it. MTA needs tracking and tagging implementation and, usually, an analytics platform subscription to stitch identifiers across channels. Once time is counted, neither one is free.
What's the difference between incrementality and attribution?
Attribution, what MTA does, assigns credit across touchpoints it can already observe, with no control group. Incrementality testing measures causal lift by holding a group back, a geo or user-level holdout, and comparing it against a group that was exposed. One answers "who gets credit," the other answers "did this spend cause anything," which is exactly why incrementality testing is this comparison's calibration check on both MTA and MMM rather than a third attribution method.
Figures and images in this post are free to reuse under CC BY 4.0 with credit to Mission Growth.
Get Mission Growth highlighted in your Google results.