SaaS Conversion Rate Benchmarks for 2026, by Stage
SaaS conversion rate benchmarks by funnel stage, channel and trial model, plus three questions that tell you whether a published number actually applies to you.
On this page
A good SaaS conversion rate depends entirely on which stage you're grading. The two best-sourced reports on the topic don't agree, even when they're grading the same one.
ChartMogul's February 2026 survey caps card-free free-trial conversion at a 10-15% GREAT band. FirstPageSage's own client data puts that identical stage, trial signup to paid, at 18.6% to 29.0% depending on industry, clearing ChartMogul's own ceiling every time.
Neither report is wrong. They measured different populations, and knowing which one your funnel resembles matters more than memorizing either number.
You likely landed here with a number already in hand, from GA4, your CRM or a trial cohort, plus a search results page full of conflicting SaaS conversion rate benchmarks that don't say which of five different rates they're even measuring.
That's the real problem with most SaaS conversion rate advice: it hands you a percentage without saying what "converted" means, whose data it came from, or why your own number might legitimately sit somewhere else entirely.
Here's what the two best-sourced reports actually say, stage by stage:
- ChartMogul's February 2026 survey of 200 B2B software products found a median free-to-paid conversion of 8%.
- FirstPageSage's 2025 client data puts trial-to-paid conversion between 18.6% and 29.0% depending on industry, well above ChartMogul's own top band for the same stage.
- Credit-card-required trials convert at 30%, more than five times what a card-free trial converts at, per ChartMogul.
- SEO drives 2.10% of visitors into leads in FirstPageSage's data, roughly three times PPC's 0.70%.
- Chaining FirstPageSage's five SEO-channel stages end to end gives a compounded visitor-to-close figure of about 0.077%, roughly 1 in every 1,290 visitors.
- Ruler Analytics' current benchmark puts the average conversion rate at 5.13% across 13 tracked industries as of May 2026; a lower figure attributed to it elsewhere, from a different industry count, is stale.
- 22% of ChartMogul's survey respondents build for consumers or serve both, and its own chart puts B2B-focused products at 6-10% GOOD and 15-20% GREAT, above the blended 8% median.
- Reverse trials and standard freemium both cap out near a 12% GREAT ceiling, while card-free free trials reach 15% at the same tier.
What "SaaS conversion rate" actually means
"SaaS conversion rate" names five different measurements, each covering a different slice of the funnel: how many visitors become leads, how many leads get qualified into MQLs, how many MQLs advance into SQLs, how many SQLs close, and how many free-trial or freemium signups convert into paying customers. Which benchmark applies depends on which of those five you're actually asking about.
FirstPageSage's client data tracks six funnel stages: Visitor, Lead, MQL, SQL, Opportunity, Close. Here's how each stage connects to the next:
- Visitor becomes lead. A site visitor gives up contact information or fills a form.
- Lead becomes MQL. That lead is qualified as worth marketing to further.
- MQL becomes SQL. Sales accepts the qualified lead as worth a rep's time.
- SQL becomes opportunity. The qualified lead turns into a live deal.
- Opportunity closes. The deal is worked and won.
A freemium conversion rate or free-trial conversion rate track runs alongside this one for product-led motions, covering how many people who start using the product for free end up paying for it.
That track doesn't pass through MQL or SQL at all, which is why comparing it against a sales-funnel stage compares two different games.
Each rate is just that stage's count divided by the stage before it: leads divided by visitors, MQLs divided by leads, and so on down the funnel. SEO's own 2.10% visitor-to-lead rate is exactly that: leads generated divided by visitors, expressed as a percentage. Chain all five and you get the share of visitors who ever reach Close, a number no single stage shows; the next section computes it.
The labels MQL and SQL come up again wherever a B2B team builds a KPI dashboard around them; here, they're just stage names attached to a benchmark.
A "good conversion rate" question can also point somewhere else entirely. A single landing page's visitor-to-conversion rate is a narrower metric than any funnel stage above, measuring one page rather than a whole journey, and it has its own separate SaaS-specific benchmark that this post doesn't repeat.
Pick the rate by the question you're asking, not by which number looks best:
| The question you're asking | The rate that answers it | Compare it against |
|---|---|---|
| Is my traffic attracting people who want to talk to us? | Visitor-to-lead | FirstPageSage's rate for the same channel (SEO 2.10%, PPC 0.70%) |
| Is marketing handing sales real prospects? | MQL-to-SQL | FirstPageSage's channel range, 26% to 51% |
| Is the sales team closing what it gets? | Opportunity-to-close | 32% to 40% across FirstPageSage's channels |
| Is my free trial or freemium plan working? | Free-to-paid | ChartMogul's GOOD/GREAT band for your entry model, and the B2B band if you sell to businesses |
| Is my whole funnel efficient end to end? | All five stages chained | The compounded visitor-to-close figure in the next section |
Knowing which of these five rates you're looking at decides two things: where your funnel actually leaks, and whether a channel or entry model is worth what you're spending on it. A stage rate that trails the benchmark points to the exact stage worth fixing first.
SaaS conversion rate benchmarks by funnel stage and channel
SaaS conversion rates vary by an order of magnitude between funnel stages, and by channel within the same stage. In FirstPageSage's own data, SEO's visitor-to-lead rate runs roughly three times PPC's.
A good sales conversion rate, meaning opportunity-to-close, runs 32% to 40% across the channels FirstPageSage tracks: Webinar and LinkedIn lead at 40% and 39%, Email trails at 32%.
Average conversion rate by industry isn't one number either: FirstPageSage's data below shows trial-to-paid ranging from 18.6% (Enterprise) to 29.0% (CRM) and visitor-to-trial from 5.5% to 12.6% across the same six industries shown here (FirstPageSage tracks sixteen for this metric).
| Channel | Visitor→Lead | Lead→MQL | MQL→SQL | SQL→Opp. | Opp.→Close |
|---|---|---|---|---|---|
| Webinar | 0.90% | 44% | 39% | 42% | 40% |
| 2.20% | 38% | 30% | 41% | 39% | |
| PPC | 0.70% | 36% | 26% | 38% | 35% |
| SEO | 2.10% | 41% | 51% | 49% | 36% |
| 1.30% | 43% | 46% | 48% | 32% |
Download CSV (CC BY 4.0)
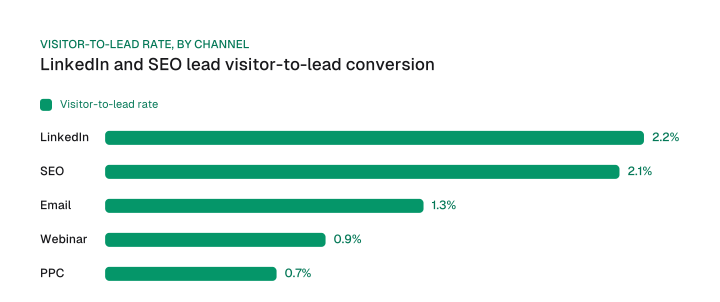
SEO and LinkedIn lead visitor-to-lead conversion at 2.10% and 2.20%; PPC trails at 0.70%. That gap alone won't tell you where your budget belongs (see how conversion rate fits your SEO KPIs for the fuller picture), but it explains why a channel mix built entirely on paid search struggles to match one that leans on SEO and LinkedIn.
Reading each stage in isolation hides how small a single visitor's odds of closing actually are. Multiply SEO's five stage rates together, 2.10% times 41% times 51% times 49% times 36%, and you get roughly 0.077%, about 1 in every 1,290 SEO visitors reaching Close. FirstPageSage's report never states that compounded figure; it only ever shows one stage-to-stage percentage at a time.
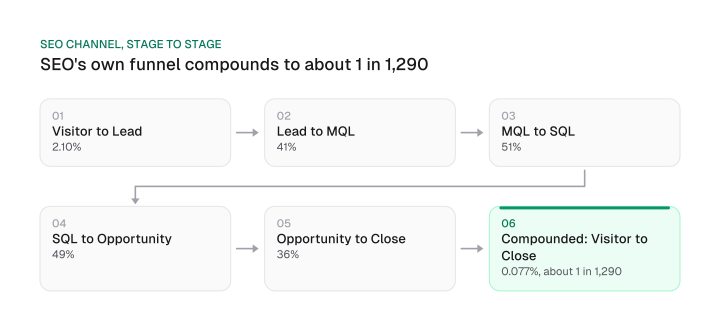
That compounded rate is the one worth forecasting from, not any single stage's percentage read on its own. If you're modeling how many visitors you need to hit a pipeline target, multiply your own five stage rates the same way rather than assuming the first one predicts the last.
Industry moves the number too, on the free trial and freemium side of the funnel:
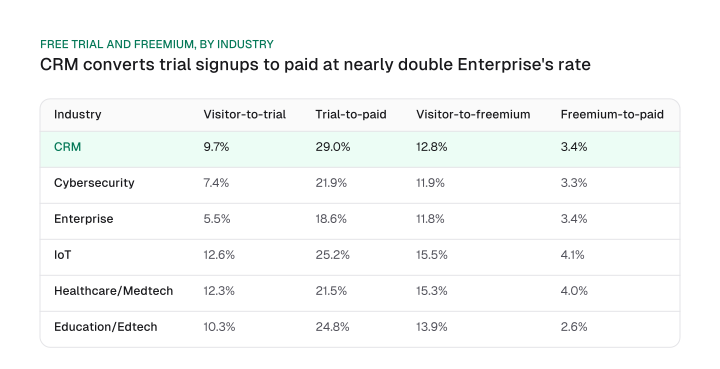
CRM products convert trial signups to paid at 29.0%, the highest of the six industries shown here, and of all sixteen FirstPageSage tracks for this metric; Enterprise software sits lowest at 18.6%. Both numbers matter for the next section, where they run into ChartMogul's own ceiling for the same stage.
One more number worth correcting before it circulates further:
"According to Ruler Analytics, the average conversion rate across 14 industries is 2.9%."
That claim carries no link or date. Ruler Analytics' own current report says otherwise: 5.13% across 13 tracked industries, based on 110M+ sessions and 5M+ conversions, published in May 2026. Use that number, not the stale one above, for a cross-industry baseline.
Free trial and freemium conversion rates: what "good" looks like by model
Free-to-paid conversion depends more on which entry model a product uses than on the industry it's in. Credit-card-required trials convert at roughly five times the rate of card-free trials in ChartMogul's data.
| Entry model | GOOD | GREAT |
|---|---|---|
| Card-free free trial | 4-6% | 10-15% |
| Freemium (standard) | 3-5% | 8-12% |
| Reverse trial | 4-6% | 8-12% |
| Freemium (ungated) | 7-9% | 8-12% |
Download CSV (CC BY 4.0)
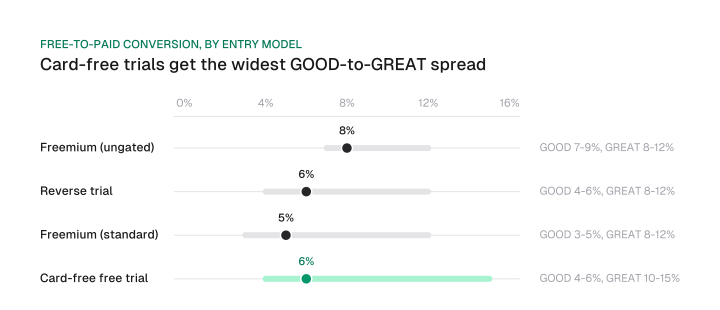
Comparing a freemium rate against a credit-card-required-trial benchmark compares two different games; the model sets the ceiling before the industry does.
ChartMogul's own claim that credit-card-required trials convert "more than 5x" the rate of card-free trials sets an upper bound too: 30% divided by 5 puts the card-free rate under roughly 6%, an estimate that tracks with the GOOD band above (4-6%) rather than the GREAT band's 15% ceiling.
| Entry model | Signups (of 1,000 visitors) | Paying customers |
|---|---|---|
| Freemium | 90 | 5 (9% visitor-to-signup, 5.5% signup-to-paid) |
| Card-free free trial | 45 | 3.6 |
| Freemium (ungated) | 70 | 5.6 |
| Trial (credit card required) | 35 | 10.5 |
Download CSV (CC BY 4.0)
Send 1,000 visitors through a credit-card-required trial and roughly 35 sign up, but 10.5 end up paying. Send the same 1,000 through a card-free trial and about 45 sign up, yet only 3.6 pay.
The lower-friction model pulls in more signups and fewer payers, which is exactly why "good" only means something once you know which model you're grading.
ChartMogul's headline number for all of this is a median of 8% across the 200 products surveyed, and that single figure hides how the bands above actually cluster: every GOOD band sits in the 3-9% range and every GREAT band sits in the 8-15% range, with little in between.
A product sitting at 8% could be reading either as GOOD for its model or the floor of GREAT for another, which is exactly why the model-specific bands matter more than the median.
The median also buries a second detail: 22% of respondents build primarily for consumers or serve both consumer and business customers, a split ChartMogul's own report breaks out elsewhere in the same GOOD/GREAT chart.
That breakdown puts B2B-focused products at 6-10% GOOD and 15-20% GREAT, against 5-7% GOOD and 8-12% GREAT for B2C or hybrid products, well above the blended 8% median a B2B-only reader might otherwise use.
Why two well-sourced benchmarks still don't agree on "good"
FirstPageSage's per-industry trial-to-paid rate beats the top of ChartMogul's own GREAT band for the same stage in every industry it tracks, from about a quarter higher to nearly double. Both reports measure the identical stage, card-free trial signup to paid, with disclosed methodology, so the two sides line up as a same-metric comparison.
Enterprise software, FirstPageSage's lowest row, converts trial to paid at 18.6%. Divide that by ChartMogul's 15% GREAT ceiling for card-free trials and you get 1.24x, about a quarter above the ceiling. CRM, FirstPageSage's highest row, converts at 29.0%. Divide by the same 15% ceiling and you get 1.93x, nearly double it.
One caveat belongs next to those numbers: "converted" doesn't mean quite the same thing in each report. ChartMogul defines conversion as a signup becoming a paying customer within six months; FirstPageSage's client-book figure carries no disclosed measurement window. The stage compared is identical, but the clock each source runs isn't, and that's worth knowing before you treat the gap as purely a population difference.
The population difference explains FirstPageSage's higher B2B SaaS conversion rate figures. Its numbers come from 50 or more B2B SaaS clients it directly manages, mostly $10M-$100M in revenue, businesses that already invest in full-funnel marketing support before a trial ever starts.
ChartMogul's 200 respondents are self-selected survey takers spanning every maturity level, answering a Typeform with no vetting for how much go-to-market support they already have in place. A managed client base converting trials better than an open survey of strangers isn't a contradiction; it's what you'd expect once you know who's in each sample.
How to grade a conversion-rate benchmark before you trust it
A conversion-rate benchmark is only comparable to your own number if its denominator, its sample and its measurement window all match. Three questions catch most mismatches before you act on a borrowed number:
- Does the denominator match? A rate measured against visitors isn't the same rate measured against leads or signups. Confirm which base a published number uses before you compare it to yours.
- Is it real usage data or a self-reported survey, and how was the population selected? An agency's own paying client book skews toward businesses that already invest in growth; an open survey skews toward whoever chose to answer it. Neither is wrong, but neither represents "the average SaaS company" either.
- Does the measurement window match? A 30-day conversion window and a six-month window produce different numbers for the identical funnel. Check what window the source discloses, if any.
Run the stale Ruler Analytics claim quoted above through this check and it fails on the first question alone: no link, no date, no disclosed source page to confirm what it's even measuring. Ruler Analytics' own current report, 5.13% across 13 industries, is the one to cite instead.
Get this right before you build a startup SEO budget around a number that turns out to measure a different denominator than yours.
How to improve your SaaS conversion rate (and where to go deeper)
Improving a SaaS conversion rate starts with picking the single stage where the benchmark gap is largest. Run your own numbers through the three-question check above, find the stage where you trail the reference furthest, and fix that one first.
Whatever the benchmarks say, you can still raise a SaaS conversion rate by using your own history as the reference: pick the stage whose rate dropped most since last quarter, change one thing there, and read the same stage again next quarter before touching another.
No-budget moves exist at every stage too, before any tactic from the sections below:
- Visitor-to-lead. Compare your channel mix against the table above; a channel converting under 1% (PPC in FirstPageSage's data) is a candidate to pause before you spend more on it.
- Lead-to-MQL and MQL-to-SQL. These show the widest range in the table, 26% to 51%; a gap that big usually means the lead-qualification bar needs a look before the channel does.
- Trial or freemium signup-to-paid. Check whether your trial requires a credit card: that single setting predicts roughly a 5x conversion difference in ChartMogul's data, before any other change.
- Opportunity-to-close. Compare your own close rate against the 32-40% range above; a rep team closing well under 32% has a process problem that more volume at the top of the funnel won't fix.
Where you go next for deeper tactics depends on which stage that is:
- Trial-to-paid mechanics. The opt-in versus opt-out formula and cohort measurement discipline deserve their own deeper treatment than this benchmark post can give.
- Entry model choice. Freemium, free trial and reverse trial is a decision with its own tradeoffs beyond conversion rate alone.
- Earlier funnel stages. B2B conversion rate optimization tactics, including why most B2B pages can't run a valid page-level test, cover that fix in depth.
- KPI dashboard design. Building a full dashboard around MQL and SQL targets is its own project, beyond using them as stage labels here.
- CRO tooling. Whether AI-driven CRO tools actually move the number is a buying decision separate from the benchmark question this post answers.
For the SEO channel specifically, this fits as part of a broader SaaS SEO strategy: the visitor-to-lead rate is the first lever, and it's the one most SaaS SEO work targets directly. And if you're deciding which metric to run your next growth experiment against, free trial conversion rate is usually the most useful one to pick, since it sits closest to revenue of any rate above visitor-to-lead.
Two well-sourced benchmarks can disagree by nearly double at the same stage without either being wrong, which means the highest number on the page is never the right one to chase. Grade your own rate against the report whose sample looks like your business, run it through the three-question check, and fix the stage with the widest gap first.
Frequently asked questions
Does the 22% B2C/hybrid mix in ChartMogul's survey change what its 8% median means for a B2B-only reader?
Yes. 22% of the 200 surveyed products are B2C or a B2C/B2B hybrid, and ChartMogul's own report does isolate it elsewhere in the same chart: B2B-focused products land at 6-10% GOOD and 15-20% GREAT, against 5-7% GOOD and 8-12% GREAT for B2C or hybrid products, well above the reported 8% median blend.
What is a good SaaS conversion rate?
There's no single number: it depends on which stage and which entry model you mean. Trial-to-paid runs 18.6% to 29.0% by industry in FirstPageSage's client data, versus a 10-15% GREAT ceiling for card-free trials in ChartMogul's survey; visitor-to-lead runs under 3% in either report. Match your stage and model to the tables above before comparing.
Is 2.5% a good conversion rate?
There's no single answer: the stage decides it. As a freemium or free-trial free-to-paid rate, that number falls below every GOOD band ChartMogul reports. As a visitor-to-lead rate through a channel like PPC (0.70% in FirstPageSage's data), it would sit well above typical.
Is a 10% conversion rate considered good?
Same logic, a different stage. As free-to-paid conversion, 10% lands in or near the GREAT band for most entry models ChartMogul tracks. As trial-to-paid in FirstPageSage's per-industry data, 10% would trail every industry listed, all of which run from 18.6% to 29.0%.
What is a free trial conversion rate?
It's the share of people who start a free trial and go on to become paying customers. ChartMogul's data puts card-free free-trial conversion at 4-6% (GOOD) to 10-15% (GREAT), while credit-card-required trials convert far higher, around 30%, because requiring a card upfront filters out casual signups before the trial even starts.
What's the difference between SaaS CRO and e-commerce CRO?
SaaS conversion rate optimization deals with a funnel that includes trials, freemium tiers and sales qualification, often with a buying committee rather than a single shopper; e-commerce CRO optimizes a single purchase decision. B2B conversion rate optimization tactics for the SaaS side are worth a separate, deeper look than this benchmark post gives.
Figures and images in this post are free to reuse under CC BY 4.0 with credit to Mission Growth.
Get Mission Growth highlighted in your Google results.