Viral Coefficient: What a K-Factor Below 1 Actually Costs
Viral coefficient (K-factor) measures how many new users each user brings in. Get the formula, a worked example, cycle time math, and what K under 1 buys.

On this page
Viral coefficient (K-factor) measures how many new users each existing user brings in through referrals. It's the number teams reach for whenever a growth meeting turns to K-factor, and most k-factor marketing advice stops at one line: above 1 compounds on its own, below 1 needs help.
How to calculate viral coefficient is only the start: the cycle-time math changes how fast a given K-factor compounds, and a K-factor below 1 still delivers real savings through lower blended acquisition cost.
What is a viral coefficient (K-factor), and how do you calculate it?
K-factor, or viral coefficient, tells you how many new signups one existing user generates through referrals. The formula multiplies the average number of invitations a user sends by the share of those invitations that convert into a signup: K = i x c, where i is invitations per user and c is the conversion rate on those invitations.
The term is borrowed from epidemiology, where a disease's growth rate comes from multiplying how many people an infectious person contacts by how likely each contact is to catch it. Applied to a product, K = 1 marks the break-even point. Above it, each generation of referred users adds more than it started with. Below it, the loop shrinks generation over generation unless something else feeds it new users.
That number is real, and it's also incomplete. K-factor only counts new users traceable to a trackable invite or share link, so it structurally misses word-of-mouth growth through untracked, "dark social" channels: a text message, a Slack mention, a conversation nobody logged. Reforge built an alternative for that gap.
- Reforge's Word of Mouth Coefficient tracks new organic users as a function of active users, not invites sent.
- One Reforge analysis of 3+ years of weekly-active-user data at an e-commerce company found active users and new organic users correlated with an R-squared of 0.958.
- That correlation is tight enough to use as a planning input on its own, separate from K-factor.
- A product with heavy off-platform sharing, a B2B tool recommended in Slack, a consumer app shown to a friend in person, will always show a lower K-factor than its real referral-driven growth, because K-factor alone can't see that channel.
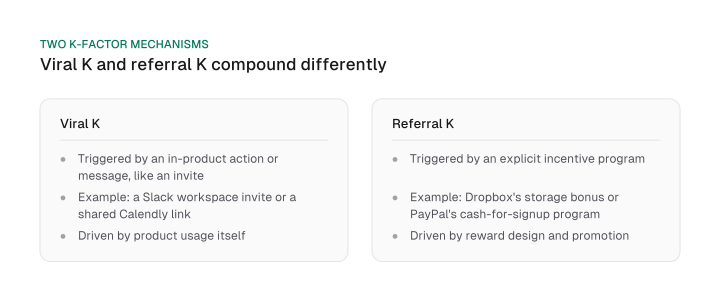
This is what "k-factor virality" misses when it's treated as one clean number: two different mechanisms both get called K-factor, and they compound differently. Viral K comes from an in-product or messaging loop the user didn't have to be incentivized into, like a Slack workspace invite or a shared Calendly link. Referral K comes from an explicit incentive program, like Dropbox's storage bonus or PayPal's cash-for-signup program.
Building or running that kind of incentive program is its own discipline. Our how to create a referral program guide covers incentive design, reward mechanics and promotion.
| Viral K | Referral K | |
|---|---|---|
| Trigger | In-product action or message (a link, an invite) | Explicit incentive program |
| Example | Slack workspace invite, Calendly link | Dropbox storage bonus, PayPal cash referral |
| What drives it | Product usage itself | Reward design and promotion |
A social-sharing variant exists too. Social K-factor, defined by Anand Jagannathan at Engage.Social, is Social Coefficient times Sharing Ratio. The Social Coefficient captures content quality, the networks it lands on and the sharers' influence; the Sharing Ratio captures how likely that content is to get shared at all. It measures organic content spread, a different mechanism from invite loops, so it complements K rather than replacing it.
One clarification before you search for more: the EU's Regulation 2019/2033 also defines "K-factor" capital requirements for investment firms, covering risk to client, market and firm exposure. That's a capital rule for investment firms, unrelated to anything in this post beyond sharing a name.
Growth channels don't operate alone. If you're weighing a referral loop against organic search as a channel, SaaS SEO strategy is the other half of that budget conversation.
Viral cycle time: why it compounds growth as much as K
Viral cycle time is the elapsed time for one loop cycle, from an invite going out to the invited user activating.
It changes how fast a given K-factor compounds, because total growth scales as K raised to the power of elapsed time divided by cycle time. Two products can share the same K-factor and still grow at very different speeds if one loop closes in five days and the other takes a month.
David Skok, writing at For Entrepreneurs in 2009, named Viral Coefficient and Viral Cycle Time as the two parameters that drive viral growth, with growth over a period equal to K raised to the power of t divided by ct, where t is the elapsed period and ct is the cycle length.
Cut the cycle length in half over the same elapsed period, and the compounding multiple squares. That's the same lever as raising K itself, aimed at speed rather than conversion rate.
Here's the math on an illustrative product. Say K = 1.2 and you're looking at a 30-day window.
- At a 10-day cycle time, you get 3 cycles in 30 days: 1.2^3 = 1.728x growth.
- Cut the cycle time to 5 days, same 30-day window, and you get 6 cycles: 1.2^6 = 2.99x growth.
- 2.99x is 1.728 squared. Halving the cycle time squared the compounding multiple, without touching K at all.
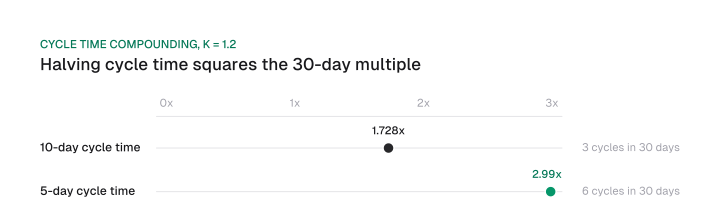
That's why shortening the loop often beats chasing a higher K-factor: faster onboarding, a same-session invite prompt, a notification instead of an email. Each one shrinks the exponent's denominator instead of its base.
The same compounding logic applies wherever a channel's returns build on themselves instead of resetting each month; see how that plays out for organic search in SEO ROI.
What a K-factor below 1 still buys: the blended CAC math
A K-factor below 1 still lowers your blended customer acquisition cost, because blended CAC equals paid CAC multiplied by (1 minus K). Say your paid CAC is $50, an illustrative number to run the formula on, not an industry benchmark.
| K-factor | Blended CAC | Share of paid CAC |
|---|---|---|
| 0.2 | $40 | 80% |
| 0.4 | $30 | 60% |
| 0.6 | $20 | 40% |
| 0.8 | $10 | 20% |
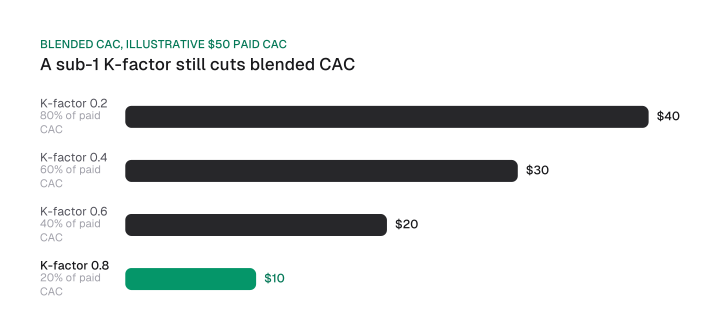
Treating a sub-1 K-factor as "not viral, ignore it" throws away real savings. At K = 0.4, the loop cuts your effective acquisition cost by 40%, real budget whether or not it ever crosses K = 1.
That reframes the question. Instead of asking whether the loop will ever go viral, ask how much it's already saving on paid acquisition, and whether that's worth the engineering cost to maintain.
To see how that CAC saving stacks up against what you're paying elsewhere, run your own numbers through the LTV:CAC ratio calculator.
Check product-market fit before you chase K above 1
K-factor optimization pays off only once retention has stabilized, because virality before product-market fit accelerates churn instead of growth.
Amplitude's Sandhya Hegde argued in 2017 that most advice tells founders their K-factor should be at least 1, but timing matters more than the number. Virality after product-market fit can build a real business; virality before fit can kill one, because a viral loop just pushes more new users through a product that isn't retaining the users it already has.
The decision rule is simple: check whether retention has stabilized, meaning it has stopped declining, before spending effort on K-factor optimization. If retention is still declining, every referred user just accelerates the leak in a bucket that already has a hole in it. If retention has flattened, a referral loop compounds a business that's actually keeping the users it acquires.
This stays specific to K-factor, not a general product-market-fit argument: spend the engineering time on shortening cycle time or improving invite conversion only after retention has stopped declining, not before. Early-stage teams face the same sequencing question with other growth levers; see SEO for startups for the same principle applied to organic search.
Two other pitfalls sit inside the number itself. A K-factor built from paid or incentivized invitations can look like organic virality when it's paid acquisition wearing a referral coefficient's clothes, since the formula counts any invitation regardless of how it was generated.
A single K-factor snapshot also hides the trend: one aggressive campaign spikes it for a week and reads as sustained virality unless you compute it per cohort, the way the next section does.
How to measure K-factor and cycle time in practice
K-factor and cycle time are measured by timestamping two events per invite, invite sent and invitee activated, then computing K and the median gap per weekly cohort. Neither number requires specialized tooling, just two timestamps you're probably already logging somewhere.
- Log two events per invite. Record
invite_sent(with the sending user's ID and timestamp) andinvitee_activated(with the timestamp the invited user completes your activation event, rather than merely signing up). - Group by weekly cohort. Bucket invites by the week they were sent, so you can watch K and cycle time move over time instead of averaging across your whole product history.
- Compute K per cohort. For each weekly cohort, divide invitations sent by the number of users who sent them (that gives i), then divide conversions by invitations sent (that gives c). Multiply i x c for that cohort's K.
- Compute cycle time per cohort. Take the gap between
invite_sentandinvitee_activatedfor each converted invite, and use the median (not the average, which a handful of slow activations will skew) as that cohort's cycle time. - Watch both trend lines together. A cohort with a flat K but a shrinking median cycle time is compounding faster even though K alone didn't move, per the math in the cycle-time section above.
That's the whole instrumentation: two timestamps, one cohort grouping, two computed numbers per week. Once you're tracking a referral channel this closely alongside organic, your SaaS SEO strategy is the other data source worth putting in the same weekly review.
Viral coefficient tells you whether a product's referral loop pays for itself or just makes paid acquisition cheaper, and cycle time decides how fast that shows up. A K-factor below 1 is not a verdict to ignore the channel: run the blended CAC math above on your own paid CAC number before you write it off.
K-factor is one input among several in a full growth model; growth model walks through where it fits alongside acquisition, activation and retention.
Frequently asked questions
Does viral marketing actually work?
Only after product-market fit. Virality accelerates whatever retention curve a product already has: a strong one compounds into real growth, a weak one just loses users faster. Amplitude's 2017 analysis found virality before fit can kill a startup rather than build it.
What does "virality" mean?
A product spreading through user-to-user referral or sharing instead of paid or owned channels. The viral coefficient formula, K = i x c, is one way to measure how much of that spread is happening.
Is a K-factor above 1 realistic?
It's rare and usually temporary. K above 1 means the user base is still growing on referrals alone, and that kind of growth almost never survives market saturation once the addressable audience for invites shrinks.
What's the difference between viral K and referral K?
Viral K comes from in-product or messaging loops, like an invite link inside the product. Referral K comes from an explicit incentive program, like a cash or credit reward for referring a friend.
How do I measure viral cycle time?
Timestamp when an invite is sent and when the invited user activates, then take the median gap between those two timestamps per weekly cohort. That median, tracked cohort over cohort, is your cycle time.
Figures and images in this post are free to reuse under CC BY 4.0 with credit to Mission Growth.
Get Mission Growth highlighted in your Google results.