B2B Conversion Rate Optimization in 2026: What Works
B2B conversion rate optimization fails when it borrows B2C's playbook. See real SaaS benchmarks, the buying-committee math, and when to skip A/B testing.
On this page
Most B2B conversion rate optimization advice is B2C advice wearing a different logo: swap the CTA color, add a testimonial, test the headline. That approach to b2b saas conversion rate optimization ignores the buying committee standing between a form fill and a closed deal, and it ignores that most B2B pages don't get enough traffic to test anything validly.
What changes once the buyer is a committee, not one person: the math behind why a small per-person gain compounds into a much bigger deal-level gain, the real SaaS conversion benchmark, the traffic floor below which testing stops making sense, and the pipeline metric that actually tracks whether any of it worked.
Why B2B conversion rate optimization needs its own playbook, not B2C's
B2B conversion rate optimization treats "conversion" as one link in a chain a buying committee has to approve. A single visitor clicking one button rarely decides anything on its own, which is why most B2C CRO advice underperforms on a B2B site.
A B2C purchase is usually one person, one card, one session. A B2B purchase runs through several people who each have to say yes before a deal closes; the page that gets the first click is rarely the page that closes it.
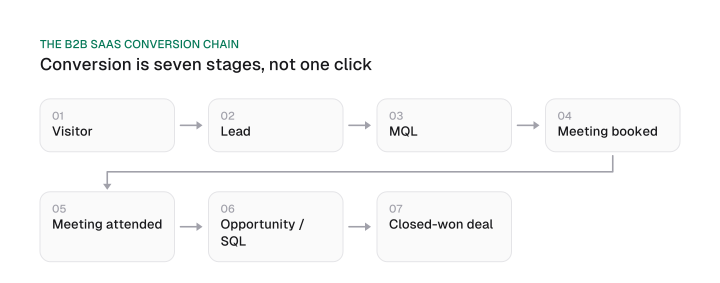
RevenueHero, a scheduling and routing platform for B2B SaaS sales teams, lays out this chain in its own conversion model: a visitor becomes a lead, then a marketing-qualified lead, then a booked meeting, an attended meeting, an opportunity or sales-qualified lead, and finally a closed-won deal. Every stage in that chain can leak.
A generic CRO checklist built for B2C only ever touches the first stage: swap the CTA color, add a testimonial carousel, shave a fraction of a second off page load. It has nothing to say about the five stages after the form.
Optimizing one page in isolation caps out fast when six more approvals stand between that page and revenue. SEO can fill the top of this chain with the right visitors; b2b seo strategy is what gets a buying committee to the site at all. What happens after they arrive decides whether that traffic ever turns into revenue.
What counts as a good B2B conversion rate
A good B2B conversion rate depends on which report's definition matches what's being measured. The b2b conversion rate benchmarks cited most often for this question measure different events entirely.
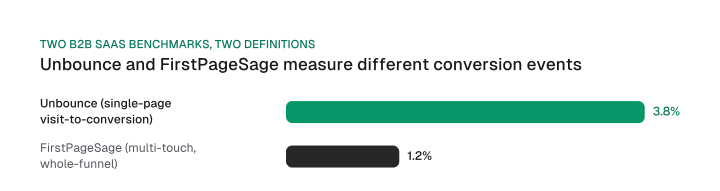
Unbounce's Conversion Benchmark Report, compiled from a dataset of 41,000 landing pages that together logged 464M pageviews and 57M conversions, puts the median SaaS-category conversion rate at 3.8%, below the report's blended all-industry median of 6.6%.
That 3.8% figure is what a B2B SaaS demo or trial page should compare itself against: it is a landing-page rate, conversions over the visitors that page received.
Benchmarks differ for lead gen and ecommerce because the two count different endpoints. An ecommerce conversion is usually the purchase itself, while a B2B lead-gen conversion is a form fill whose value gets decided later, deeper in the pipeline.
Unbounce's 6.6% is a median across all industries, not a lead-gen figure. A demo page benchmarked against that blend is being measured against the wrong mix of pages.
FirstPageSage's Average Conversion Rate by Industry & Marketing Channel report puts the B2B SaaS industry average conversion rate at 1.2%, less than a third of Unbounce's 3.8% SaaS-category median. Both figures are accurate; they answer separate questions about b2b website conversion performance.
The two reports define a conversion differently. Unbounce's own definition of conversion rate is total conversions over total landing page visitors, a single page's visit-to-conversion rate, and its benchmark is built from landing pages.
FirstPageSage counts a prospect as converted once any marketing channel touches them and they later take a conversion action (a contact-form fill, a sales or marketing email reply, a direct purchase, or a demo/free-trial signup), a multi-touch, whole-funnel rate drawn from FirstPageSage's own client dataset (70% B2B, 30% B2C, clients worked with January 2020 through December 2023).
Divide Unbounce's 3.8% by FirstPageSage's 1.2% and the two figures sit 3.2x apart. The two reports draw on different datasets, and they count different things as a conversion: a landing-page visit versus a full multi-touch funnel. That is why the gap says nothing about which number is right.
Match the benchmark to what's being measured. Benchmarking a single landing page's visit-to-conversion rate calls for Unbounce's 3.8% SaaS-category median. Benchmarking whole-channel or multi-touch marketing effectiveness calls for FirstPageSage's 1.2% B2B SaaS average.
Cross-comparing the two produces a false read in both directions: a multi-touch rate above FirstPageSage's 1.2% looks weak next to Unbounce's 3.8%, and a landing page below the 3.8% median looks strong next to 1.2%.
| Source | Defined event | Figure | Use it for |
|---|---|---|---|
| Unbounce Conversion Benchmark Report | Total conversions over total landing page visitors (single-page visit-to-conversion) | 3.8% | Benchmarking a single landing page |
| FirstPageSage Average Conversion Rate report | Prospects touched by a channel who later took a conversion action (multi-touch, whole-funnel) | 1.2% | Benchmarking whole-channel or multi-touch marketing effectiveness |
Download CSV (CC BY 4.0)
A B2B conversion rate is typically calculated as qualifying actions (form submissions or meetings booked) divided by unique visitors to the page, expressed as a percentage. Run the calculation separately for each page type rather than blended across the whole site: a demo page and a case-study page rarely convert at the same rate, and a single site-wide average hides that split.
The buying committee changes what you optimize, not just how
A B2B buying committee turns conversion into a chain of independent approvals. That structure compounds a small improvement in each person's odds into a much larger gain at the level of the whole deal, more than the same lift would produce in a B2C funnel with just one buyer. Getting a real read on committee size and its sourcing belongs to b2b seo strategy's own coverage of the buying committee.
Here, the math only needs a small, explicitly simplified example to show how the arithmetic works. Suppose, for illustration only, a five-person committee where each stakeholder independently has a 70% chance of approving a deal. Because every approval has to happen, the committee-level probability is 0.7 raised to the fifth power, or roughly 16.8%.
Now raise each stakeholder's individual odds to 80%, a single, modest 10-point improvement per person, the kind a better one-pager or a sharper answer to one objection could plausibly produce. The probability at the committee level becomes 0.8 raised to the fifth power, roughly 32.8%, about double, from a change that would barely move a conversion rate with just one buyer.
That's the multiplication a headline test on one page never touches, and it's the argument for persona-specific pages and shareable assets for a champion over another round of copy tweaks on the same page everyone lands on. B2B copywriting covers writing to each stakeholder in that committee once the page exists.
This math also explains a heuristic B2B marketers repeat without always saying why it holds: the "rule of seven," the idea that a prospect needs roughly seven touches before converting. In a B2B committee, that rule doesn't describe one visitor returning seven times.
It describes several stakeholders, each needing their own round of touches: a case study for the economic buyer, a technical FAQ for the security reviewer, a peer reference for the champion, before every independent approval in the chain clears at once.
Fix the real B2B friction: forms, qualification and the post-form gap
In B2B conversion, user experience means form friction, qualification steps and the post-form gap, well before it means page polish or visual design. The friction that actually kills B2B conversion sits in the form and in the gap right after it: qualification and scheduling, not checkout or cart abandonment, concepts that don't exist in a demo or trial funnel.
Statsig's "CRO Meaning" article advises B2B SaaS teams to track "abandoned carts" as a friction signal, but a demo or trial funnel has no cart. The same list already names low trial engagement; the cart line is the one that doesn't transfer, and demo no-shows are the B2B equivalent RevenueHero's own funnel model points to.
Start with the form itself. RevenueHero's Inbound Conversion Benchmark Report, built from over a million form submissions, found conversion barely moves with field count: 77% conversion at 2 fields versus 76% at 13 fields.
| Field count | Conversion rate |
|---|---|
| 2 fields | 77% |
| 13 fields | 76% |
Download CSV (CC BY 4.0)
That one-point gap means the form itself is rarely where a B2B qualification problem lives. A field-stripping redesign is a low-yield fix if the goal is more qualified pipeline rather than a marginally higher submit rate.
The bigger lever sits after the form closes. Default, a meeting-scheduling and lead-routing vendor, analyzed 88,047 inbound leads and found that connecting a form directly to a scheduling tool cut average response time from 48 minutes to 2 minutes by removing the manual step between a form submission and a booked call.
RevenueHero's own benchmark, drawn from the same million-plus form submissions, puts the median qualified-to-booked-meeting rate at 62% once a lead is actually qualified and someone follows up. The gap between a fast, automated handoff and a slow, manual one is where most of the real B2B conversion loss sits, rather than in the form's field count.
Audit the post-form gap: time to first response, routing rules, scheduling friction, before touching page copy or CTA color. The form isn't broken. What happens in the minutes after it's submitted usually is.
Why most B2B pages can't run a valid page-level A/B test
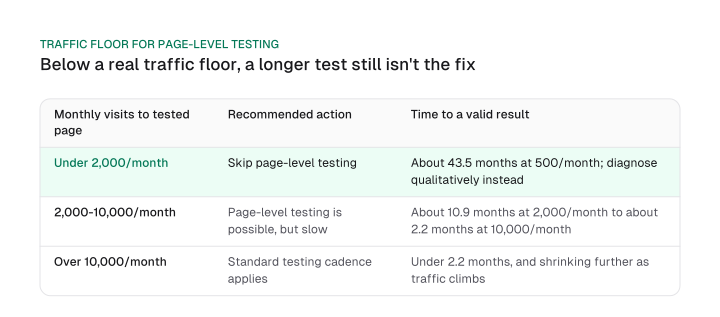
Most B2B demo, contact and pricing pages get too little monthly traffic to reach a statistically valid A/B test result in a useful timeframe, which is why the fix below a real traffic floor is qualitative diagnosis rather than a longer test.
Running the standard two-proportion sample-size formula (95% significance, 80% power) against Unbounce's real 3.8% SaaS baseline, testing for a 20% relative lift (moving from 3.8% to 4.56%) requires about 21,738 total visits to the tested page before the result means anything.
That traffic requirement plays out very differently depending on how much a page actually gets:
- 500 monthly visits: about 43.5 months, well over three years, to collect enough data for one valid test
- 2,000 monthly visits: about 10.9 months
- 5,000 monthly visits: about 4.3 months
- 10,000 monthly visits: about 2.2 months, the only tier where a single test finishes in a reasonable window
That gives a concrete rule: below roughly 2,000 monthly visits to the page being tested, skip page-level A/B testing. A valid result would take the better part of a year even at a generous 20% relative lift, and a test left running past its planned window usually gets called early on noise, rather than a real effect.
Diagnose instead: session recordings, qualification-call notes, account-level tracking of who actually converts, then fix what those tell you directly, without waiting on a test the traffic can't support. Between 2,000 and 10,000 monthly visits, page-level testing is technically valid but still slow, running from roughly 10.9 months down to 2.2 months across that band.
Above 10,000 monthly visits, this math converges with growth experiment cadence's general traffic-tier guidance, and that post's cadence and prioritization mechanics (ICE/PIE scoring, backlog hygiene, ritual review cycles) apply as written. For the sample-size formula itself and how to choose the effect size being tested for, see minimum detectable effect.
Measure conversion to pipeline, not lead count
A B2B conversion program should report pipeline and revenue outcomes alongside raw form-fill counts, because a form-simplification win that raises fills while lowering SQL quality is a net loss dressed up as a win. Reporting qualified pipeline, rather than raw form-fill counts, is the standard this section holds to. What's missing from most conversion dashboards is a way to sanity-check that pipeline math itself.
Here's that check, built by chaining two independently sourced vendor benchmarks rather than one measured cohort. Default's own analysis of 88,047 inbound leads found 19,493 turned into qualified bookings, a 22.1% lead-to-qualified-booking rate (19,493 divided by 88,047).
RevenueHero's benchmark separately puts the qualified-to-booked-meeting rate at 62%. Chaining those two rates (22.1% multiplied by 62%) implies that roughly 1 in 7 raw leads, about 13.7%, becomes a booked meeting at benchmark performance.
That's an order-of-magnitude estimate combining two different vendors' datasets, rather than a number measured on one company's actual funnel. It's still a useful sanity check: a team converting far below that on a comparable funnel has a diagnosable gap somewhere between lead and meeting, and not only a top-of-funnel volume problem.
Report SQL and opportunity movement next to form-fill counts, never instead of them. A page redesign that doubles form fills while halving the qualified rate has made the dashboard look better and the pipeline worse.
Account-based tie-ins matter here too: a form-fill count from a target account carries more pipeline weight than the same count from an account that will never buy, one more reason a raw lead-count metric misleads on its own.
Once organic traffic is producing this kind of qualified volume, SaaS SEO covers which page types actually turn that traffic into trials, and the SEO ROI formula covers translating a conversion lift into a revenue number once pipeline is the metric being reported.
B2B conversion rate optimization fails when it borrows B2C's assumption of one visitor and high page traffic. Measuring pipeline instead of lead count is the shared premise underneath that correction; the committee math and the traffic-floor arithmetic above are what turn that premise into something actionable.
A buying committee multiplies independent approvals into a much bigger gain than a single-buyer lift would produce, and most B2B pages don't get enough traffic to validly test at all.
The next step is arithmetic, not another checklist: run the sample-size formula above against your own tested page's real monthly traffic and your own baseline conversion rate. If the answer puts a valid result more than a few months out, stop waiting on a test and start auditing the post-form gap instead: routing speed, qualification criteria, the handoff from marketing to sales.
Frequently asked questions
Is a low conversion rate normal for B2B?
A low conversion rate is only low relative to the category being measured against, not to any single number in isolation. Compared with Unbounce's SaaS-specific median of 3.8%, a rate sitting meaningfully below that benchmark points to a real gap worth diagnosing, separate from B2B's naturally longer sales cycle.
What is a good B2B conversion rate?
Use the category-specific number instead of the blended one: Unbounce's own data puts the SaaS median at 3.8%, well below the 6.6% blended all-industry figure most "good conversion rate" advice quotes.
What is the rule of 7 in B2B?
It's a commonly used marketing heuristic holding that a prospect needs roughly seven touches before converting. In a B2B buying committee, it plays out as several stakeholders each needing their own round of touches, rather than one visitor returning seven times.
How soon can B2B CRO show results?
For b2b cro run as a page-level A/B test specifically, it depends on the page's traffic: the sample-size math above puts a valid result anywhere from about 2.2 months at 10,000 monthly visits to well over three years at 500 monthly visits. Below roughly 2,000 monthly visits, skip the test and diagnose qualitatively instead.
What is a good sales conversion rate?
This is a different metric from site conversion rate: it measures qualified opportunities closing into deals, a stage well past a visitor converting on a page. Chaining two independent vendor benchmarks (Default's lead-to-qualified rate and RevenueHero's qualified-to-booked rate) implies roughly 1 in 7 raw leads becomes a booked meeting at benchmark performance, a useful sanity check for the earlier pipeline stages feeding that sales number.
What makes B2B conversion rate optimization different from B2C?
A B2C purchase is usually one visitor's single decision. A B2B purchase runs through a buying committee where every stakeholder's independent approval has to clear before a deal closes, which is why a per-person improvement compounds into a much larger deal-level gain than the same lift would produce in a single-buyer funnel.
Figures and images in this post are free to reuse under CC BY 4.0 with credit to Mission Growth.
Get Mission Growth highlighted in your Google results.