
Log file analysis SEO: verify Googlebot, match Crawl Stats
Log file analysis SEO guide, step by step: verify real Googlebot, build a status-by-section report and see why Crawl Stats totals will not match your log.

On this page
Log file analysis SEO work starts with a surprise: Search Console's Crawl Stats total and your server log will disagree, and the gap comes from how Google counts. Read the log as what reached your server and Crawl Stats as what Google counts, reconcile them in that order, and only then act on either. The log is also where you see whether Googlebot requests the URLs your xml sitemap lists.
This guide takes you from one raw log line to a first report of verified Googlebot requests, then reads each status code the way Google documents it.
Log file analysis SEO: what logs show that Search Console cannot
Log file analysis reads your server access logs to see which URLs search engine bots requested, when, and what status your server returned, so it is the source record that crawlers and Search Console summarise.
SEO log file analysis only works once you know what each record can and cannot see. A site crawler shows what your pages link to. Crawl Stats shows what Google reports having counted. Only the log holds every request your server received and the response it gave. Comparing log URLs to a crawl is also one way to find orphan pages: URLs Googlebot still requests that no internal link reaches.
The three overlap but never match exactly. Crawl Stats adds a field the log lacks, the crawl purpose, which separates discovery of new URLs from refresh of known ones.
Each request in a redirect chain is counted as a separate request, requests for page resources that sit on your site are counted too, and the total can run higher after a stretch of robots.txt unavailable errors. A log has none of those labels, so you use both.
The technical SEO checklist carries the one-line check; the rest of this guide is the worked report behind it.

What one Googlebot request looks like in your log
A Googlebot request line in Apache or nginx combined log format holds the client IP, timestamp, request method and URL, status, bytes, referrer and user agent, and nothing about how long the server took.
Apache documents the Combined Log Format as the common format plus referer and user agent, and nginx uses a predefined "combined" format when you name none. One illustrative line, with placeholders for the values that vary:
203.0.113.7 - - [DD/Mon/YYYY:HH:MM:SS +0000] "GET /blog/example-post/?ref=nav HTTP/1.1" 200 BYTES "https://example.com/" "Mozilla/5.0 (compatible; Googlebot/2.1; +http://www.google.com/bot.html)"
Read it left to right. The first value is the client IP, the only field that proves who sent the request, so it feeds the verification step below. The bracketed timestamp carries a timezone offset; when you merge files from several servers, normalise every line to one zone before you sort.
The request field holds the method, URL and protocol, and Googlebot analysis keeps GET and HEAD lines only, because those are the fetches that read a page. Keep the query string on the URL, since parameter URLs are where waste hides. The status and byte count follow, then the referrer and the user agent, which is a claim about identity and nothing more.
The default format answers "which URL, which status" but not "how slow", so you add two fields before you start collecting. The first is request duration, the second is cache status wherever a CDN or proxy exposes one.
Both additions go at the end of the format string so existing parsers keep working:
# Apache: append %D after the user agent
LogFormat "%h %l %u %t \"%r\" %>s %b \"%{Referer}i\" \"%{User-agent}i\" %D" combined_timed

# nginx: append $request_time after the user agent
log_format timed '$remote_addr - $remote_user [$time_local] "$request" $status $body_bytes_sent "$http_referer" "$http_user_agent" $request_time';

Pull the log from the right layer
Ask for the log from the layer that sees Googlebot's requests: the CDN edge if one sits in front of your site, otherwise every origin server, with request duration added to the format before collection starts.
A log only holds what reaches its layer, so an origin log behind a CDN undercounts crawler requests, whatever server log analysis SEO method you run on it.
Our log only sees requests that reach our Worker and match a known bot family or a generic bot pattern, plus every request for llms.txt or llms-full.txt from any client; blocked or edge-cached requests and human page views are not in it.
Pick the layer with this rule:
- Origin only: fine when no CDN or cache sits in front; every request reaches the server.
- CDN edge: the layer to request when a CDN fronts the site, because the edge answers many crawler requests itself.
- Edge plus origin: use both when you want to see which crawler requests the CDN absorbed and which it passed through.
- Several origin servers: collect every one and merge them after converting each timestamp to the same zone.
Logs usually arrive in one of three shapes: Apache or nginx combined format, IIS W3C format, or a JSON export from a CDN. Servers rotate them, so a month of data is often several files, with the older ones rotated and gzipped. Stream all of them into one pipe with zcat -f, which also passes plain text files through. DevOps can answer a request faster when it is written out:
Please export access logs for [DATE RANGE] from [the CDN edge / every origin server],
in combined format with request duration added ($request_time for nginx, %D for Apache),
including rotated and gzipped files, with no lines filtered out.
Keep the raw files long enough to compare before and after a change; once a migration is live you cannot recollect what the old site served. To open a single .log file, any text editor or less works. Do not upload it to a website; the privacy section below says why.
Confirm the request is really Googlebot
A request is Googlebot only if reverse DNS on its IP returns a Google hostname and a forward lookup of that hostname returns the same IP, or if the IP sits inside a range in Google's published CIDR files.
Googlebot log analysis rests on this check. Google documents both methods: command-line lookups for one-off checks, and matching against its published IP lists for large-scale work. A user-agent match alone only counts claims, because any script can send the string.
For a single suspicious IP, run the two lookups yourself:
host 203.0.113.7                 # reverse: the answer should be a Google hostname
host HOSTNAME_FROM_ABOVE         # forward: the answer should return the same IP
At log scale, match every IP against Google's JSON range files instead. The files are lists of prefixes in CIDR format, and Python's ipaddress module tests membership directly:
import ipaddress
ipaddress.ip_address(ip) in ipaddress.ip_network(prefix)
Google moved these files to /crawling/ipranges on 11 February 2026 and says the old location keeps working for now, so point new scripts at the new path. The user agent still helps you sort, since the Desktop and Smartphone crawlers both carry "compatible; Googlebot/2.1" in the string, and the report below keeps Smartphone and Desktop apart in their own column.
Other bots show up in the same file. Each operator documents its own verification route, so run the same logic against its own lists. Our guide to AI crawlers covers per-bot allow and block policy, and our AI crawler statistics show how those requests split in one site's log.

Which log file analyzer to use
A command line is enough to start, Screaming Frog's Log File Analyser is free for 1,000 log events and 99 pounds a year beyond that, and BigQuery takes over when files outgrow a desktop.
The right log file analysis tool depends on log volume and on who owns the analysis. Pay for a platform only when overlay and alerting save more engineering time than they cost. Prices below are as of November 2026.
1. Command line, pandas and GoAccess
Best for: one site whose logs fit on a laptop and a team that is happy to write three short steps.
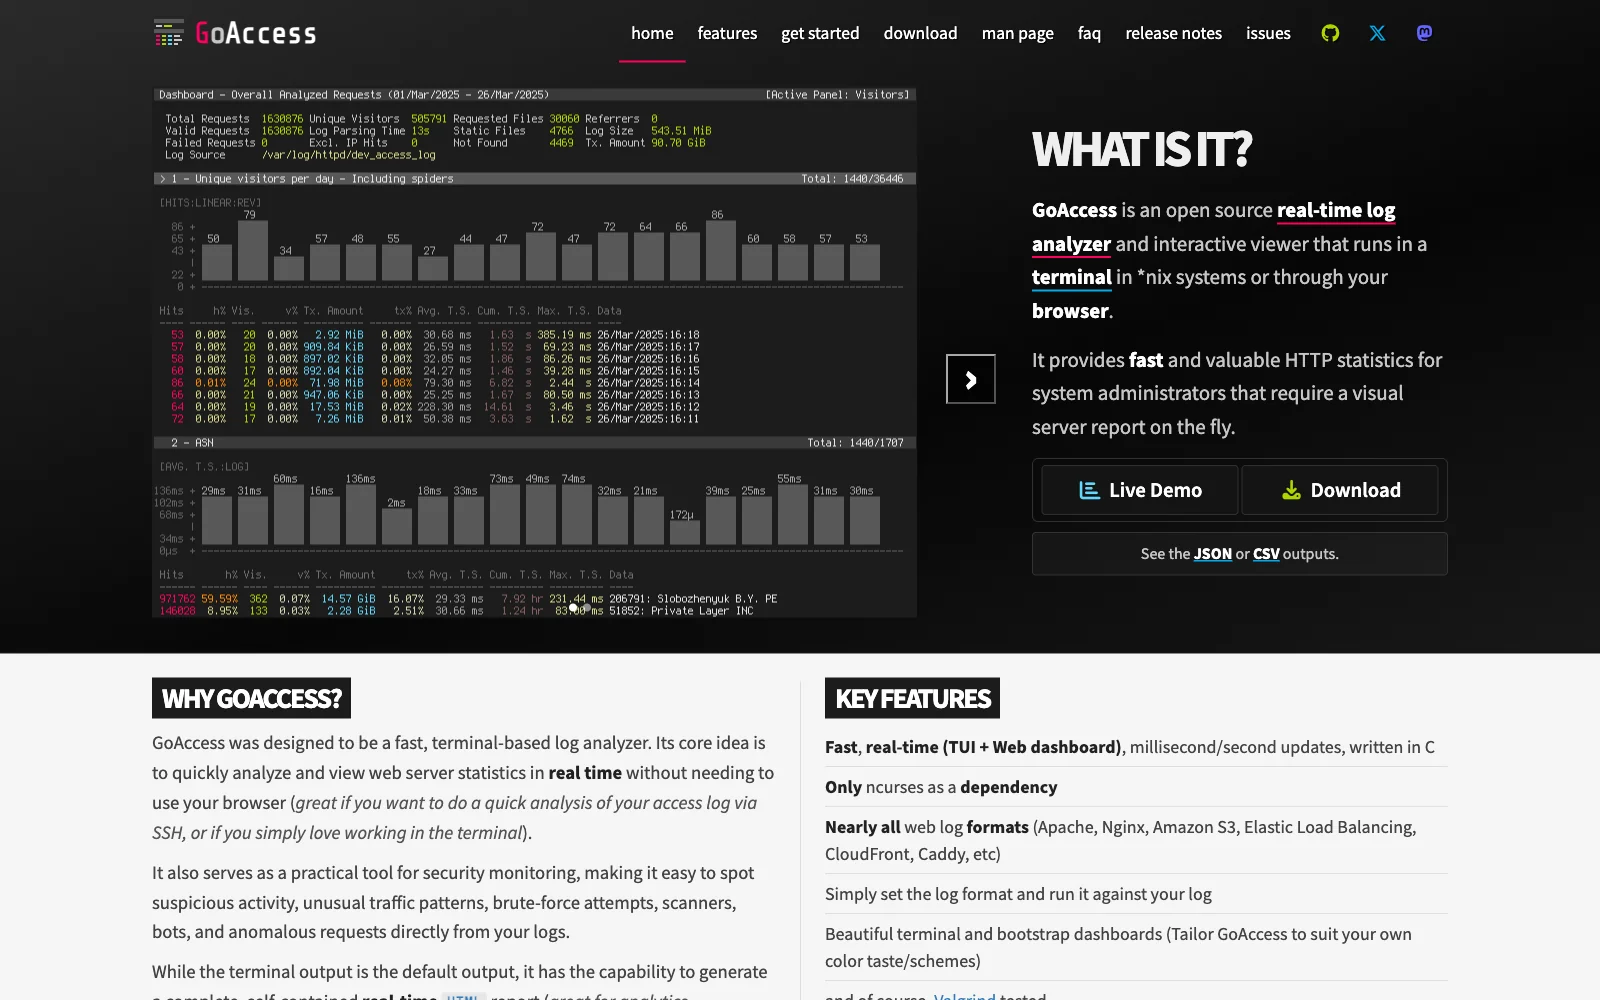
The command line is the shortest route from a log to a first report. zcat, grep and awk filter the lines, and pandas groups them, which is exactly what the report below does. Pandas reads the filtered file in a few lines, and a regular expression splits each combined line into fields.
GoAccess is an open source real-time web log analyzer and interactive viewer that runs in a terminal or through your browser.
It reads the log and charts it, and you still filter and verify Googlebot with the steps in this guide. Everything here runs offline, so no log file leaves your machine, and the same commands work on any server where you have shell access and can pipe the file.
Pros:
- Free and scriptable, so the report reruns the same way next month
- Nothing is uploaded anywhere
Cons:
- You write and maintain the filter, verification and grouping yourself
- No built-in alerts or history
Price: Free
2. Screaming Frog Log File Analyser
Best for: SEOs who want a desktop application on top of the log instead of scripts.
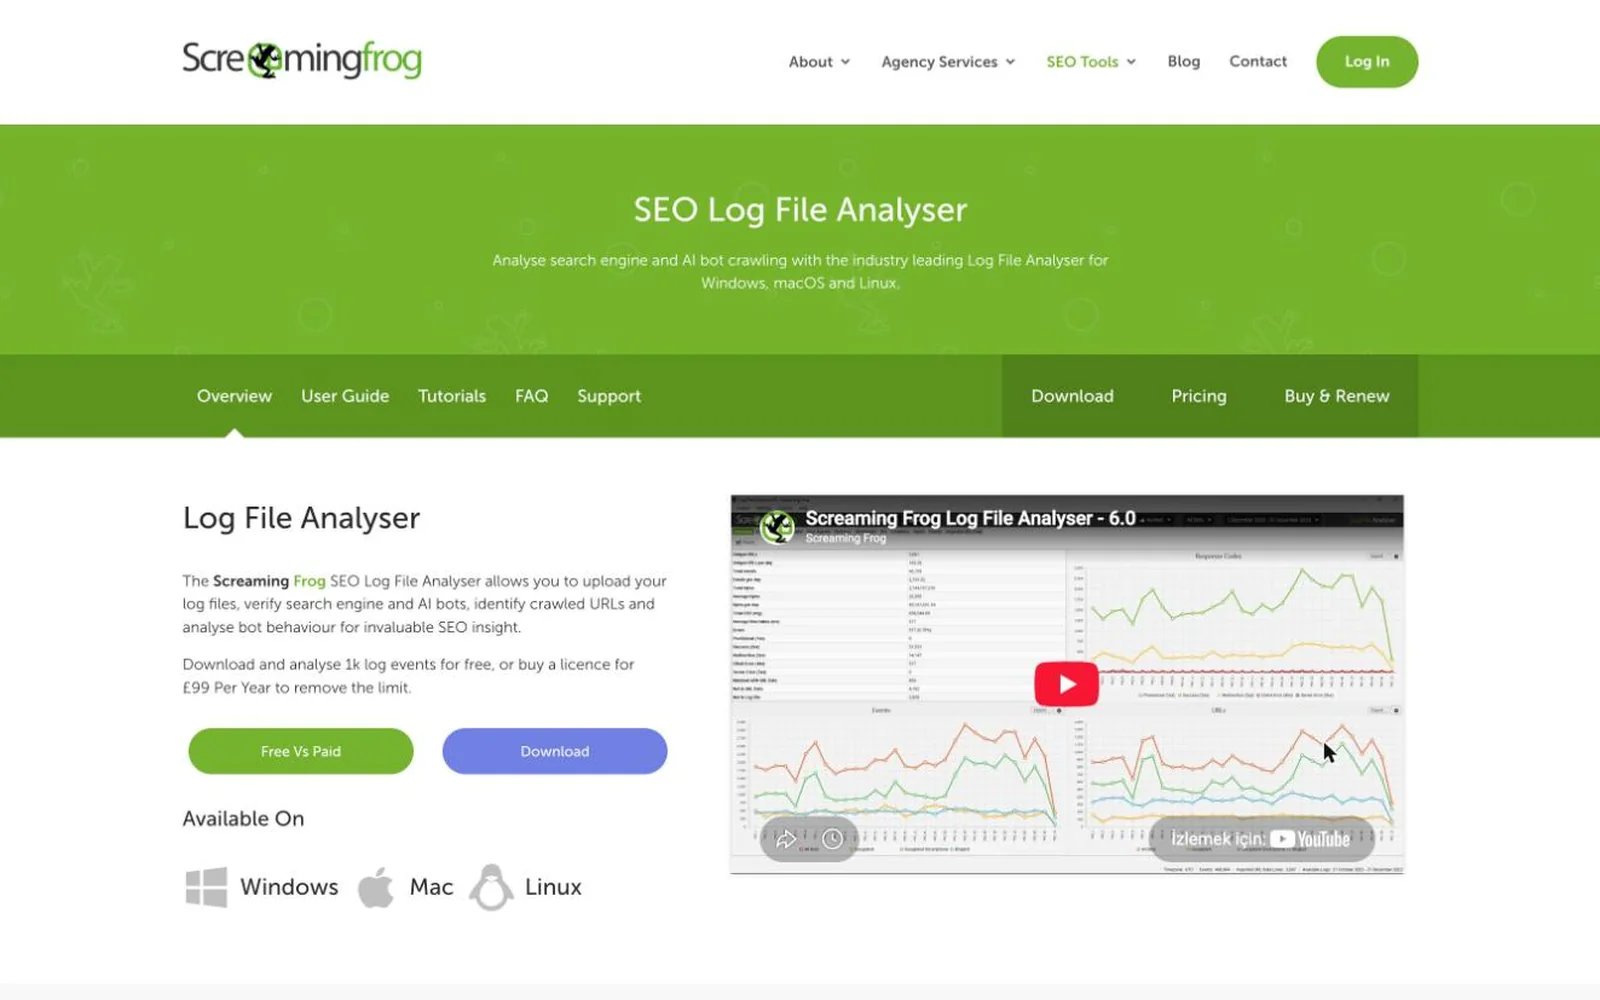
Screaming Frog's Log File Analyser costs nothing for the first 1,000 log events, and a licence at 99 pounds per year lifts that cap. The free version also stops you saving more than one project at a time, which makes it a fair way to test the workflow on a sample before paying.
A licence lasts one year and you renew it after that, which answers the licence-key question: a key covers a single year of use. Pair it with the verification step above, because a desktop tool shows what the log says about a user agent, and the user agent is only a claim until you check the IP.
Pros:
- Free download for the first 1,000 log events, so you can test on a sample
- A single annual licence removes the event limit
Cons:
- The free version saves one project at a time
- The licence must be renewed after one year
Price: Free to 1,000 log events; 99 pounds per year (as of November 2026)
3. BigQuery
Best for: sites whose logs have outgrown a desktop and need SQL over months of files.
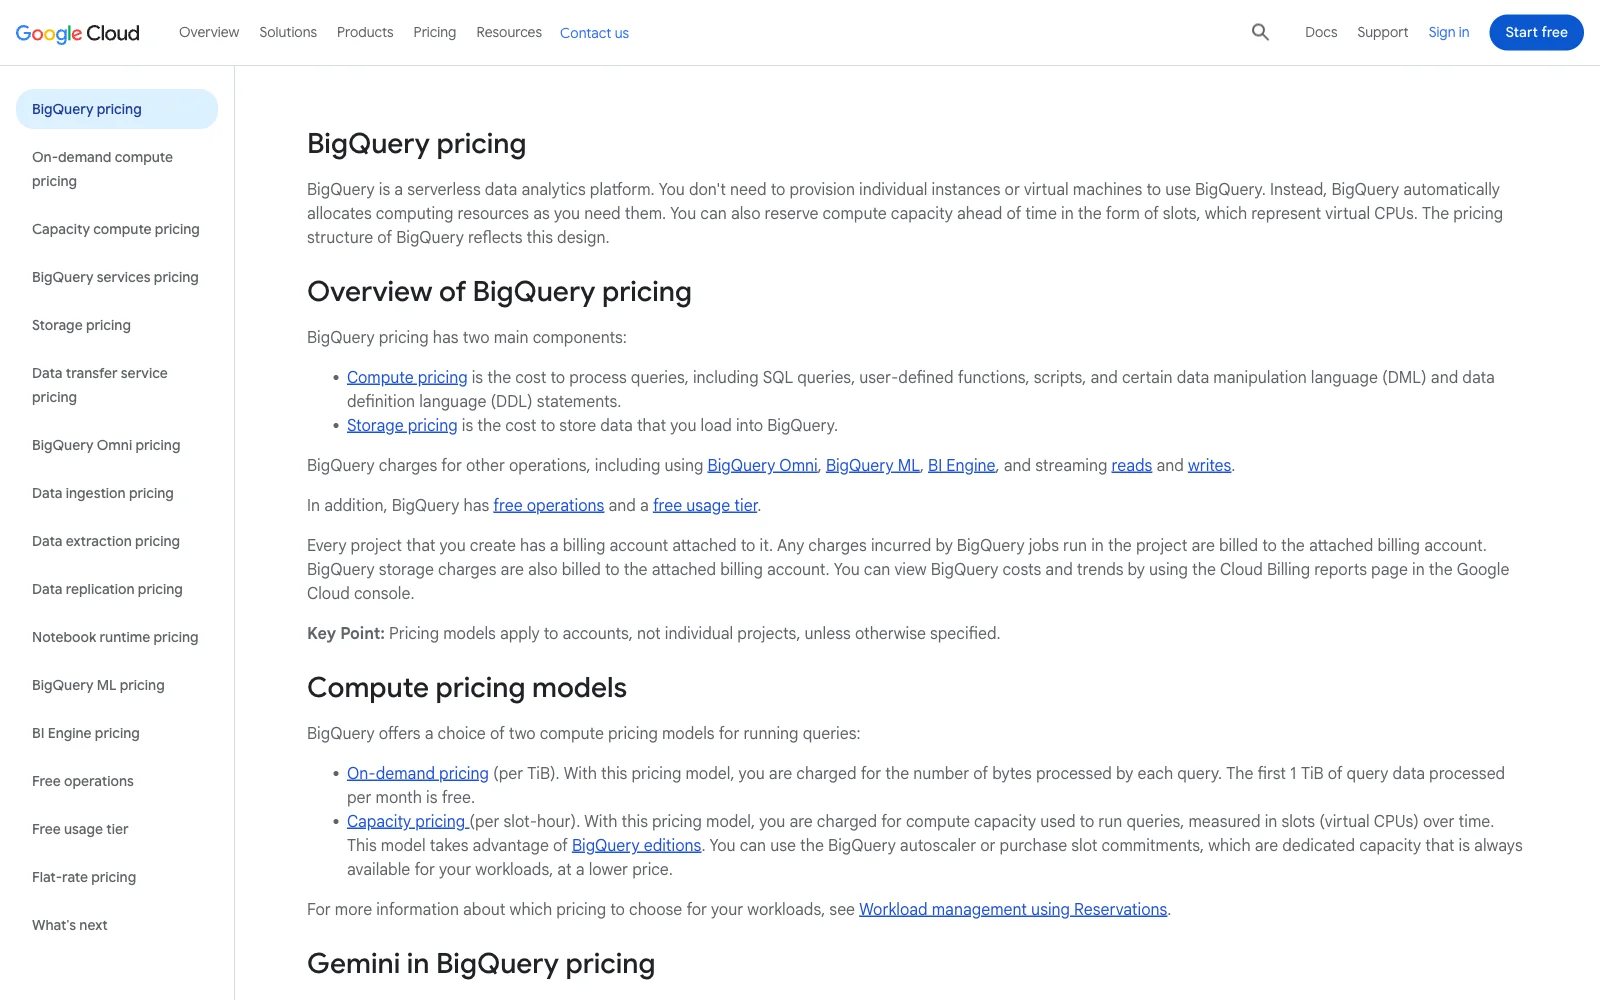
BigQuery is Google's data warehouse. You load the logs into a table and query them with SQL, so the same group-by from the report below runs over months of files at once.
Google's pricing page says the first 1 TiB of query data processed per month is free, and by default queries are billed on-demand per TiB, so you pay for the data your queries scan. In the US Iowa region that rate is $6.25 per TiB once the free TiB is used.
Filtering the file to verified Googlebot lines before loading keeps that scan small, which keeps the bill small too. Expect to build the loading step yourself; the warehouse stores and queries data, and it does not know what Googlebot is.
Pros:
- A free monthly query tier before any billing starts
- Handles log volumes a desktop app cannot open
Cons:
- Billed by data scanned, so careless queries cost money
- You load, partition and verify the data yourself
Price: First 1 TiB of query data per month free, then $6.25 per TiB scanned in the US Iowa region (as of November 2026)
Semrush's Log File Analyzer shows a chart of Googlebot activity over the past 30 days once your results are ready. Enterprise platforms that overlay crawl and log data are left out of the comparison above, which lists only tools with a stated price.
Build the first report
The first report is verified Googlebot requests grouped by site section and status code, built from the log with zcat, a user-agent filter, a CIDR check and one group-by.
It takes four steps, and the same log file analysis python recipe reruns each month on fresh logs. The output is a status code by section table of verified Googlebot requests. Every address in the code is a placeholder from the reserved documentation range.
Step 1: zcat the rotated files and filter by user agent
The first command reads every rotated log, compressed or not, and keeps only lines whose user agent claims to be Googlebot.
zcat -f access.log* | grep "Googlebot" > googlebot-raw.log
Step 2: load Google's CIDR JSON and build a test
The IP test turns Google's published ranges into a function that answers whether one address belongs to Googlebot.
import ipaddress, json, urllib.request

# Google's published ranges, a JSON list of CIDR prefixes (see /crawling/ipranges)
URL = "https://developers.google.com/crawling/ipranges/googlebot.json"
data = json.load(urllib.request.urlopen(URL))
nets = [ipaddress.ip_network(v)
        for p in data["prefixes"] for k, v in p.items() if k.endswith("Prefix")]

def is_googlebot_ip(ip):
    addr = ipaddress.ip_address(ip)
    return any(addr in n for n in nets)
Step 3: parse the combined line and keep verified Googlebot only
The parser splits each combined log line into fields and drops any request whose IP fails the test.
import re
import pandas as pd

LINE = re.compile(r'^(\S+) \S+ \S+ \[[^\]]+\] "(\S+) (\S+) [^"]*" (\S+) \S+ "[^"]*" "([^"]*)"')
rows = []
for line in open("googlebot-raw.log"):
    m = LINE.match(line)
    if not m:
        continue
    ip, method, url, status, ua = m.groups()
    if method not in ("GET", "HEAD") or not is_googlebot_ip(ip):
        continue
    section = "/" + url.lstrip("/").split("?")[0].split("/")[0]
    agent = "smartphone" if "Mobile" in ua else "desktop"
    rows.append({"section": section, "agent": agent, "status": status})
df = pd.DataFrame(rows)
Step 4: group by section and status
The group-by counts verified requests per site section, crawler type and status code.
report = df.groupby(["section", "agent", "status"]).size().unstack(fill_value=0)
report["total"] = report.sum(axis=1)
print(report.sort_values("total", ascending=False))
Both Googlebot strings count as Googlebot, which is why the agent column exists: a split between the two tells you which crawler a problem comes from. The result is a table with sections down the side and statuses across the top. Its shape, with placeholder section names and no real counts:
A table of sections by status for verified requests is the smallest report that finds a real problem, and every later section in this guide reads from it.

Read each status code the way Google does
Google follows up to 10 redirect hops, treats a 301 as a strong signal and a 302 as a weak signal, temporarily slows crawling on 5xx and 429, and crawls 4xx URLs less often over time.
For 500 errors the slowdown is proportionate to the number of URLs returning a server error. Act on the status codes your own links and sitemap produce; a code that Google merely reports needs no fix. Each row below comes from Google's HTTP status documentation.
Two rules fall out of the table. A temporary slowdown after errors is recovery behaviour, so do not rewrite the site because the log shows a dip; fix the error and watch the rate come back. And a throttle you set yourself, like a 503 to slow the crawler, should come down once Google's crawl rate has adapted.

Why Crawl Stats will not match your log
Search Console's Crawl Stats counts every redirect hop and page resource as a request and can include fetches Google never made because robots.txt was unavailable, so its total can exceed the Googlebot lines in your log.
Crawl log analysis starts from that gap, since redirect hops and resources are counted separately. Google says so itself: if the total crawl count is much higher than Google crawling requests in your server logs, that can happen when Google cannot crawl your site because robots.txt is unavailable for too long. The gap is a diagnostic, so check the causes in order before you suspect the log.
Reconcile in three steps:
- Check robots.txt availability over the window first. A robots.txt that returned errors for too long is the one cause Google names for a total that is much higher than your server logs.
- Count redirect chains. Because each hop is counted separately, a site with many chains inflates the Crawl Stats total relative to unique page fetches.
- Split resources from pages in the log, then compare the page lines with the Crawl Stats total.
If a URL is missing from Crawl Stats' examples, that does not mean Google never requested it, and your log is the place to settle it.
Crawl Stats also labels crawls as Discovery or Refresh, a split the log cannot rebuild. Capacity and demand, the two sides of what Google crawls, sit in the crawl budget guide.

Find crawl waste by section
Crawl waste shows up as a section that takes a large section share of verified Googlebot requests while returning mostly non-200 responses or URLs you do not want indexed. Take two columns from the first report: each section's share of all verified requests, and the share of those requests that returned something other than 200. Plot every section on those two axes and act on the quadrant it lands in.
- High share, high non-200 share: fix this section first. Googlebot spends much of its time here and gets errors or redirects back. Typical causes are filter URLs, old paths with chains and broken internal links.
- High share, low non-200 share: a content decision. Googlebot likes these pages and your server answers them cleanly, so ask whether they all deserve indexing. Thin or duplicate variants belong with index bloat and its own cleanup.
- Low share, high non-200 share: a small leak. Fix it when the errors come from your own links.
- Low share, low non-200 share: leave it alone.
Google's crawl budget guide frames the stakes by size: sites with 1 million+ unique pages and content that changes about weekly, or 10,000+ unique pages that change daily, are the ones it addresses. Below that, the same table still finds broken sections; it just does not decide rankings. Causes and fixes for each source of waste live in our crawl budget guide, so this section stops at finding the section.

Match log URLs against your crawl and sitemap
Comparing the URLs Googlebot requested with your crawl and your sitemap sorts every URL into a group, and the URLs that are in the log but missing from the crawl are where orphan pages and trap URLs hide.
Export three URL lists, one from each source, and join them on the normalised URL.
The third row is the one to open first. A URL Googlebot keeps requesting that your own crawl cannot reach has no internal link pointing to it, or sits behind a parameter pattern your crawler did not follow. The join tells you what to look at; the orphan pages guide tells you what to do about it.
The same list lets you compare sitemap entries with real crawl dates, and the xml sitemap guide covers the file itself.
Do not redirect every 404 the log shows
Google recommends fixing only the 404 errors you link to yourself or list in a sitemap, so an old URL that bots still request needs no redirect unless a real replacement exists.
A log full of 404s feels like a fire, and Rank Math's glossary page gives this advice:
Identify the URLs causing these errors and redirect them to working URLs.
Google's own help says otherwise. Its page-indexing guidance tells you to fix only the 404s you link to yourself or list in a sitemap: "In general, we recommend fixing only 404 errors that you link to yourself or list in a sitemap. If a page has been moved, you should return a 3XX redirect to the new page."
Newly encountered 404 pages are not processed, and crawling frequency gradually decreases. A server error is a different case: a 500 is a fault in your server to fix, and a redirect would only hide it.
Triage each 404 in three lines:
- Does your site link to it or list it in a sitemap? Fix the link or remove the entry. This is the only group Google asks you to fix.
- Did the page move? Redirect it to the page that now holds the content, and only that page. Send it to the closest page that holds the same content. For maps after a move, see our site migration seo guide.
- Is it gone for good, or never existed? Return a 404 or 410 and let it age out. Bots will keep asking for a while and slow down on their own.
Share only the crawler lines
Your access log holds visitor IP addresses, which the UK regulator lists in Recital 30 among online identifiers, so filter to verified crawler lines before you hand a file to a vendor or an online analyzer. The ICO's list of identifiers names internet protocol (IP) addresses, cookie identifiers and other identifiers such as RFID tags. This guide makes no claim about US law.
The rule is short. Verified crawler lines carry no visitor data and answer the SEO questions, so share those and keep the human lines in-house. You already built the filter: step 3 of the report keeps only lines whose IP passes the Googlebot check, and writing that subset back out gives you a file safe to send.
zcat -f access.log* | grep "Googlebot" > googlebot-raw.log
# then keep only the lines whose IP passes is_googlebot_ip() and write them to a new file
Do this before you upload to any online tool. Some tools process the file in your browser and others send it to a server, and you cannot assume which one without reading the vendor's notes.
When to run it and how often
Run log analysis after a migration or launch, after an unexplained crawl or traffic drop, and on a schedule once the first report exists, because Crawl Stats alone cannot tell you which URLs Google skipped.
The first trigger is the strongest. After a migration, the log is the only place to see whether Googlebot is requesting new URLs and following redirects. Keep the raw logs from before the change so you can compare against them.
Whether you need it at all depends on size. Google says a site under a thousand pages should not need Crawl Stats, so a small site can skip log work. Sites past Google's crawl-budget thresholds of 1 million+ pages updated weekly or 10,000+ pages updated daily should run it on a schedule. Mid-size sites run it at moments of change.
The cadence is advice: a quarterly or monthly rhythm after the first report suits most teams. Fold it into your regular technical SEO audit and the migration calendar.
The point of this guide stands: your log is what reached your server, Crawl Stats is what Google counts, and the gap between them is a checking order. This week, ask DevOps for the log from the right layer with the request above, run the four steps, and read the status table before you touch a single redirect.
Frequently asked questions
Can I run log file analysis without a paid tool?
Yes. For one site, zcat, grep and awk, or pandas, are enough to build the status-by-section report in this guide. Screaming Frog's Log File Analyser is also free for the first 1,000 log events, with a limit of one saved project. Paid tools mainly add convenience, charts and alerts.
Do I need logs if I have Search Console?
Yes, because the two totals differ. Crawl Stats counts each redirect hop and page resource as a request and can include fetches Google never made when robots.txt was unavailable, while your log holds the requests that reached your server. Use the log first, then reconcile against Crawl Stats.
How do I open a .log file?
Open it in any text editor or with less in a terminal. Rotated files ending in .gz need zcat first, which reads several of them as one stream. Do not upload a raw access log to a website to view it, because it contains visitor IP addresses.
Does a log file analyzer upload my logs?
It depends on the tool, so check before you send anything. Some run on your machine and others process files on a server. Either way, filter the file down to verified crawler lines first, since visitor IP addresses are listed among online identifiers in the UK regulator's guidance.
How do I analyze Apache or nginx logs for SEO?
Treat them the same way. Apache's Combined Log Format and nginx's predefined combined format hold the same fields, so the four steps are identical: filter and stream the files, verify the IPs, parse each line and group by section and status. Add request duration to the format before you collect.
Is a request with a Googlebot user agent really Googlebot?
Not necessarily. The user agent is a string any client can send. Verify the IP with a reverse DNS lookup and a matching forward lookup for a single address, or against Google's published CIDR range files when you check a whole log.
Which log file analysis tool is best?
Choose by log volume. A command line with pandas or GoAccess suits files a laptop can read, Screaming Frog's Log File Analyser costs nothing up to 1,000 events and 99 pounds a year after, and BigQuery handles larger files with a free first 1 TiB of queries each month. See the tool cards above.
How do I find crawl waste in a log?
Group verified Googlebot requests by site section and status code, then compare each section's share of requests with its share of non-200 responses. The section that is high on both is where crawl waste sits. Causes and fixes for each source of waste sit in the crawl budget guide.
Cite this page
Aktaş, F. (2026, November 15). Log file analysis SEO: verify Googlebot, match Crawl Stats. Mission Growth. https://missiongrowth.io/blog/log-file-analysis
Figures we made for this post are free to reuse under CC BY 4.0 with credit to Mission Growth.