Generative Engine Optimization Statistics 2026, Graded
Generative engine optimization statistics, reconciled: market forecasts 2.2 times apart by 2032, 12% enterprise budgets and 8.90% measured page adoption.
By Furkan AktaşPublished
On this page
Generative engine optimization statistics come in six grades of evidence, and the grades disagree. Three market forecasts sit 2.2 times apart by 2032 once each is carried on its own endpoints.
Self-reported practice shows the same split: 97% of professional services marketers have done some GEO, against 37% of all US marketers who invest anything. This page also carries one page-level measurement, 8.90% of retrieved pages, which counts pages and not teams, so we never set it against the surveys.
These GEO statistics are as of October 2026, each with its sample, its date and a link to the body that produced it, so you can check any figure before you quote it. Where a number is a self-reported adoption figure, a projection or a measurement, we say so.
Key generative engine optimization statistics, October 2026
The key generative engine optimization statistics fall into market forecasts, funding, adoption, budgets and tested lift, and each carries its sample and date.
These AI search optimization statistics are worth copying, and each reads on its own:
- Forecast, Dimension: Dimension Market Research projects a USD 1,089.3 million GEO market in 2026 reaching USD 17,148.6 million in 2034 (February 2026).
- Forecast, MarketsandMarkets: MarketsandMarkets estimates USD 390 million in 2025 and USD 4,250 million by 2032 (summary page read in October 2026, ahead of the report's listed publication date).
- Forecast, Coherent: Coherent Market Insights projects a USD 1.25 billion GEO services market in 2026 and USD 13 billion by 2033, and states 14% a year while those endpoints imply 39.7% (published August 2026).
- Funding: Dealroom counts seven GEO startups that have raised $472 million, 71% of it by Profound (September 2026).
- Professional services adoption: Scribewise found that 97% of 205 professional services marketers say they have done at least some GEO (September 2025).
- All-marketer investment: Centerfield found that 63% of 878 US marketers say their company invests no time, budget or staff in GEO (August 2025).
- Enterprise budget: in a survey of more than 250 senior executives responsible for AEO/GEO/SEO at enterprise organizations, Conductor reports that enterprises put 12% of digital marketing budgets into AEO/GEO in 2025 (January 2026; Conductor is an AEO platform vendor).
- Measured prevalence: the GEO-Flag detector found GEO in 8.90% of 10,095 pages retrieved for 1,000 real queries (August 2026).
- Tested lift: the Princeton GEO paper reports visibility gains of up to 40% in a lab engine (KDD 2024).
- Adoption decay: in C-SEO Bench, gains fall as more actors adopt the same methods (first posted June 2025, revised October 2025).
- Competition payoff: in a multi-brand experiment, individual payoff fell from +0.802 to +0.007 when every brand used the same strategy (October 2026).
For the wider picture of ranking and citation studies, see our AI SEO statistics. This page keeps to GEO's own market, money and tested lift.
How to read a GEO number: six grades of evidence
A GEO statistic supports only the claim its method can show, and the numbers on this page fall into six grades: controlled experiments, measured samples and records, surveys, social-listening models, vendor case claims and analyst projections.
Here is the ladder:
The rule that follows is simple, and you'll use it on every number below. Quote each grade only for the verb it supports: "found" for experiments, "measured" for samples, "said" for surveys, "projects" for forecasts.
If you want to know which domains and formats engines cite, that belongs to our AI citation statistics page.
The visits AI answers send back to websites, and how those visitors convert, are counted in AI referral traffic statistics, while how marketing teams use AI day to day sits in AI marketing statistics.
Methodology is short. We opened each source in October 2026 and traced every figure to the page that produced it. Projections carry publisher and date, derived numbers show their formula in the sentence, and we collected no original data.
GEO market size: three forecasts, three horizons, one 2.2x spread
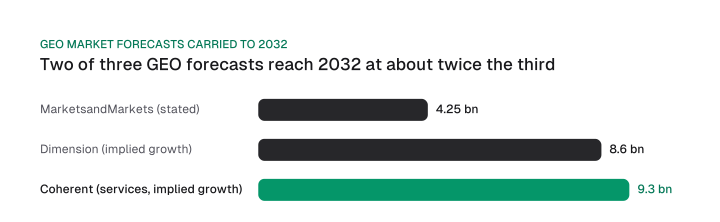
Three publishers project GEO market size from different starting points and scopes, and carried to 2032 on their own endpoints their values sit 2.2 times apart. The generative engine optimization market is a forecast. Nobody reports it as revenue.
Dimension Market Research projects USD 1,089.3 million in 2026. The table puts all three side by side:
These are publisher projections from paid reports, read from their public summary pages. None is observed revenue, and the horizons differ: 2034, 2032 and 2033, so check the horizon before you set two of them side by side.
So how far apart are they? Dimension and Coherent agree on the 2026 starting size within 15% (1,250 divided by 1,089.3, minus 1). MarketsandMarkets states no 2026 value, and its endpoints imply about USD 549 million, half of Dimension's.
To compare them at one date we carry each publisher to 2032 on its implied growth rate, the rate its own two endpoints produce. That gives USD 8.6 billion for Dimension and USD 9.3 billion for Coherent, against MarketsandMarkets' stated USD 4.25 billion.
The spread is the highest value over the lowest, or 2.2 times. The 2032 values for Dimension and Coherent are interpolations, since neither states one.
The gap comes from the starting size and the scope (market versus services) as well as from growth. If you need one figure for a deck, pick the narrowest scope that matches your claim and name the publisher and horizon. For example, a services pitch can cite Coherent's USD 1.25 billion services figure, and a category pitch can cite Dimension's USD 1,089.3 million.
Where one publisher's page contradicts itself
Coherent's page states a 14% annual rate for USD 1.25 billion in 2026 growing to USD 13 billion in 2033. Compounding 1,250 million at 14% for seven years reaches only USD 3.1 billion.
The endpoints imply 39.7% a year. The stated 14% rate and the page's own endpoints can't both hold, so if you cite this report, quote neither without that note. We take the point no further than the arithmetic.
GEO startup funding: where the money actually went
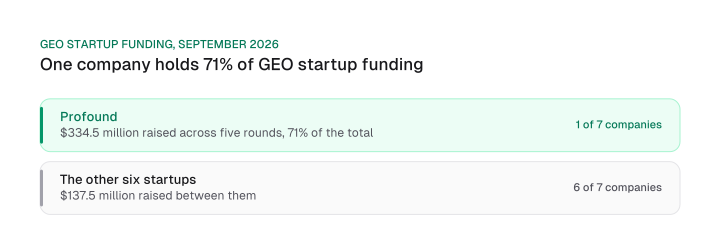
Seven GEO startups founded since 2024 have raised $472 million, and Profound alone holds $334.5 million of it, 71% of the category total.
Dealroom's record shows Profound raised five rounds in 25 months: a $3.5m seed, a $20m Series A, a $35m Series B, a $96m Series C and a $180m Series D. The Series D came on 15 September 2026 at a $1.8 billion valuation.
Add the last two rounds and you get $276 million, which is 82.5% of Profound's total and 58.5% of everything the seven companies have raised (the two rounds over the $472 million category total). The Series C landed in February 2026 and the Series D in September, so more than half of the category's venture money arrived in one company's two rounds of 2026.
The other six startups hold $137.5 million between them (the category total less Profound's share). One company of seven, 14%, holds 71% of everything the seven have raised.
Two of the seven have exits. Sitecore acquired Scrunch in June 2026 for a reported $225 million, and HubSpot acquired XFunnel in October 2025 for about $30 million.
Funding is a different grade from the forecasts above. Cumulative venture dollars aren't annual market revenue, so don't divide one by the other. And if you're choosing a vendor rather than reading a market signal, our GEO tools comparison is the right page.
GEO adoption: what marketers say versus what pages show
Generative engine optimization adoption reads as 97% in one profession's survey, 37% in an all-marketer poll and 8.90% of retrieved pages in a page-level measurement, because each counts a different thing.
The table lines up who was counted, when and what was measured:
Download CSV (CC BY 4.0)
Compare teams with teams first, because the two surveys are the closest pair here. 97% of professional services marketers did some GEO, against 37% of all US marketers investing, about 2.6 times (97 divided by 37). The populations differ, and "did some" is a lower bar than "invests time, budget or staff", so that ratio compares two different scales.
The 8.90% counts pages, so it never divides into either survey figure. What it adds is that detected practice rises to 16.36% among pages modified in 2026. The detector's output is an estimate from its own classifier, and its unit is the page.
Centerfield adds an understanding gap. 33% of its respondents say they have a good or expert understanding of GEO, versus 72% for SEO, and 41% expect their company to dedicate more GEO resources in the next year.
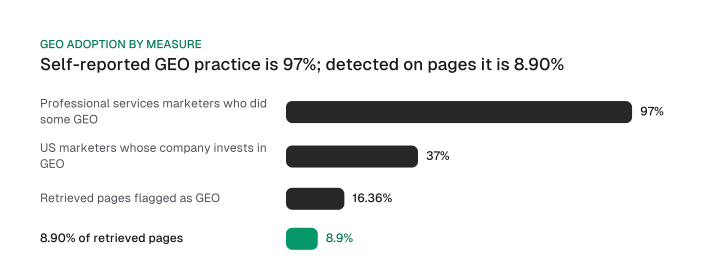
So is anyone actually doing GEO, or is it SEO with a fancy name? Yes, someone is. In Conductor's survey, enterprise respondents responsible for AEO/GEO/SEO report a 12% budget share, 37% of US marketers in Centerfield's poll invest something, and a detector finds GEO on 8.90% of retrieved pages.
What differs from SEO in the data is the spend gap. Centerfield's marketers give GEO 9% of resources against 24% for SEO, so GEO is practiced but still a fraction of the SEO line.
If you're asking about ChatGPT specifically, no source here splits adoption by engine.
If you're pitching GEO budget to a B2B or enterprise lead, you'll want the two B2B-leaning figures: Conductor's enterprise survey, where 94% plan to increase investment and the vendor runs the survey, and Scribewise's professional services frame. Both are intent and self-report. Treat them as signals about where budgets are heading, and don't present them as proof of results.
GEO budgets: what teams spend and how to size yours
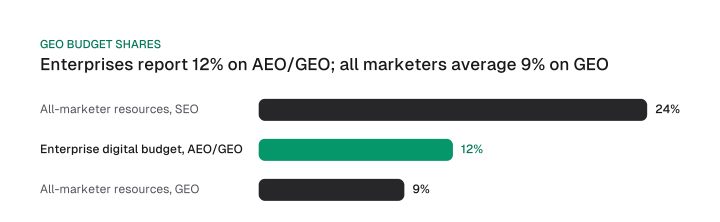
Enterprise executives in a Conductor survey report putting 12% of digital marketing budgets into AEO/GEO, while the average US marketer in a Centerfield poll puts 9% of marketing resources into GEO.
A generative engine optimization budget is a share of something larger, so the base decides the number. Conductor surveyed more than 250 senior executives responsible for AEO/GEO/SEO at enterprise organizations, and Conductor is an AEO platform vendor. Its 12% covers AEO plus GEO, for 2025.
Download CSV (CC BY 4.0)
The two shares have different bases, so they don't contradict each other. Enterprise digital budgets for AEO plus GEO come to 1.3 times the all-marketer resource share for GEO (12 divided by 9).
Inside the Centerfield sample, GEO gets 37.5% of what SEO gets (9 divided by 24). The 9% is reported as an average, and the source does not say whether the 63% who invest nothing are counted in it. We don't derive an investors-only share, because the source doesn't code it, so don't compute one yourself from these figures.
Conductor's 97% positive-impact figure is an executive self-report, and its 94% is intent. Neither is a measured return, so don't put either in a business case as proof of ROI.
Here is a worked example. Say a team has a 100,000-dollar monthly digital budget (our assumption, for the arithmetic). The two benchmarks put the GEO line at 9,000 to 12,000 dollars a month (9% and 12% of that monthly digital budget).
Which end fits? Use 12% if you're an enterprise running an AEO/GEO program, and 9% for a general marketing team. That pick is our judgment across two different bases. For how to sequence the spend once you have it, the GEO roadmap gives the order of work.
Princeton GEO paper statistics: what each lift measures and why it decays
The Princeton GEO paper reports visibility gains of up to 40%, measured in a lab engine on the 1K test split of a 10K-query benchmark.
The table lists each headline number with what the paper says it measures:
Download CSV (CC BY 4.0)
Check the scope before you repeat the 40%. The engine is gpt3.5-turbo answering from the top 5 Google results, and the benchmark holds 10K queries, split 8K, 1K and 1K, while the methods were scored on the 1K test split. The paper was published at KDD 2024.
A July 2026 survey of 45 studies by Martinez reads the gains as valid within the setting and conditional on a source already being present in a fixed context. It says they establish neither organic discoverability nor durable traffic effects. So the lift is a ceiling for content that is already retrieved, and you quote it as a relative improvement on a named metric.
What benefit has anyone seen so far? Two kinds exist, and they don't mix.
The self-reported kind is Conductor's 97% of executives who report a measurable positive business impact in 2025, a vendor-run survey. The measured kind is the lab lift above, which holds for content that is already retrieved.
For example, if a client asks what GEO has delivered, quote the 97% as "executives report" and the 40% as "a lab test found".
For the mechanism behind the 40% figure and the five-page share arithmetic, read our generative engine optimization guide.
Why the lift decays when everyone copies it
The +115.1% and -30.3% figures come from an experiment in which every source was optimized at once. So the paper's own data shows what happens when everyone applies the tactic: the top-ranked source loses and the fifth-ranked source gains. Those numbers aren't what your page gains by adding citations.
Later work points the same way. C-SEO Bench found most dedicated methods largely ineffective and gains falling as adopters rise (first posted June 2025, revised October 2025). A multi-brand experiment first posted in June 2026 and revised in October 2026 saw individual payoff fall from +0.802 to +0.007 in its payoff proxy when every brand used the same strategy, and non-participating brands received zero recommendations in those tests.
Read that last result with its limits. It covers one product category (skincare) across three commercial models and a payoff proxy, not revenue. The Martinez survey adds that no reviewed technique has a stable longitudinal cross-platform causal effect on organic discoverability.
The mechanism is plain: share is relative, so a tactic every competitor copies moves nobody. So if you've run a GEO test that worked, treat it as a lead that decays, and re-test it each quarter. Don't claim a durable gain.
The three studies measure different outcomes (word share, rank, payoff), so never add or average them. All three are lab or simulated settings.
Is generative engine optimization a thing? What the numbers support
Generative engine optimization is a measurable practice with disclosed budgets and detectable page changes, but no reviewed study shows a stable longitudinal effect on organic discoverability.
The lift matters only for content that is already retrieved.
Four numbers say the practice is real. Enterprises report 12% of digital budgets on AEO/GEO in a vendor survey, a detector finds GEO on 8.90% of retrieved pages, seven startups have raised $472 million, and 97% of one profession says it has done some GEO.
Two findings say the effect is unproven. The Martinez survey reads Princeton's gains as conditional on retrieval, and no technique it reviewed shows a stable longitudinal causal effect on organic discoverability. So why act now? Because the practice and the money are already measurable, while the lab gains are conditional and decay.
To build a strategy for AI visibility from these statistics, turn the grades into decisions. Here's which number to quote for what:
- Fund monitoring and a test budget. Don't fund a promise of lift.
- Plan inside the 9% to 12% band. The two figures have different bases, so on a 100,000-dollar monthly budget it is 9,000 to 12,000 dollars.
- Quote projections as projections. Name the publisher, the scope and the horizon; quote it only for what a forecast supports.
- Re-run the test on your own pages. A published lift is a lead, not a result for your site.
If you're still weighing GEO against classic search work, GEO vs SEO sets out how to split the effort, and the 90-day GEO plan covers the plan itself.
A GEO number is quotable once you know its grade, its population and what that grade can support. So pick the one figure you were about to cite, find its row in the ladder and rewrite the sentence with the verb it earns.
Frequently asked questions
How big is the generative engine optimization market?
Publishers project it, and they disagree. For 2026, Dimension Market Research starts at USD 1,089.3 million, and Coherent Market Insights starts at USD 1.25 billion for the narrower services market, 15% apart. Carried to 2032 on the growth their own endpoints imply, the forecasts sit 2.2 times apart.
How much do companies spend on GEO?
Enterprise executives in a Conductor survey report 12% of digital marketing budgets going to AEO/GEO in 2025. Centerfield's all-marketer poll finds 9% of marketing resources for GEO on average. The bases differ, and 63% of Centerfield respondents say their company invests nothing in GEO.
How many marketers actually do GEO?
It depends on who you ask. 97% of professional services marketers in a Scribewise survey report some GEO, while 37% of all US marketers in the Centerfield poll invest anything. A separate detector measured 8.90% of retrieved pages, which counts pages and not teams.
Is generative engine optimization a thing?
Yes, as a measurable practice: 8.90% of retrieved pages show detectable GEO, and enterprises report 12% of digital budgets in a vendor survey. No reviewed study, though, shows a stable longitudinal effect on organic discoverability, so fund tests, not promised lift.
Cite this page
Aktaş, F. (2026, October 17). Generative Engine Optimization Statistics 2026, Graded. Mission Growth. https://missiongrowth.io/blog/geo-statistics
Figures we made for this post are free to reuse under CC BY 4.0 with credit to Mission Growth.
Get Mission Growth highlighted in your Google results.