AI Referral Traffic Statistics 2026: 0.2% to 1.08% of Visits
AI referral traffic statistics for 2026: AI sends 0.2% to 1.08% of visits by panel, ChatGPT holds 62.6% to 92.4%. Includes a rule to match your site to a panel.
By Furkan AktaşPublished Updated
On this page
AI referral traffic statistics disagree because the panels behind them differ. AI platforms send between 0.2% and 1.08% of website visits, and ChatGPT's slice of that traffic reads anywhere from 62.6% to 92.4%.
If your boss asks whether your AI share is normal, ask back: against which panel? This page gives you the number to quote for five questions: share of visits, growth, platform split, conversion and undercounting. Each comes with the sample, window and denominator that make it quotable.
If you're hunting for ChatGPT referral traffic, AI search traffic share or AI chatbot traffic figures, you probably want one defensible number. You'll need a named panel behind every LLM referral figure and a named comparison group behind every AI referral conversion rate.
This page covers what AI sends back to websites. For the clicks classic results earn by rank, see organic ctr by position. How many marketers use AI is a different question, covered in ai adoption among marketers.
Key AI referral traffic statistics at a glance
You can lift the ten figures below whole, because each names its panel, scope, source and date. As of October 2026, AI platforms send between 0.2% and 1.08% of website visits, which is the AI share of website traffic in panel terms.
- Share, enterprise: AI referral traffic was 1.08% of all website traffic across 10 industries and 1,215 US enterprise customer domains, May to September 2025 (Conductor, page updated July 2026).
- Share, global sites: In Q4 2025, 6,500 websites saw AI-referred sources reach 0.2% of their traffic mix (Contentsquare, January 2026).
- Share, broad panel: All AI chatbots combined sent 3.5 million visitors in March 2026, 0.28% of total web traffic across 74,752 websites (Ahrefs, May 2026).
- Share, 2026 average: AI platforms accounted for 0.32% of all website traffic across 101,574 websites, January to April 2026 (SE Ranking, June 2026).
- Growth: Monthly LLM sessions hit 644,478 in May 2026, 9.9x the November 2024 level in a fixed panel of 166 GA4 properties (Previsible, July 2026).
- ChatGPT, low end: ChatGPT held 62.6% of measurable B2B AI referrals in March and April 2026, brand-averaged (Goodie, May 2026).
- ChatGPT, high end: ChatGPT held 92.4% of trackable LLM referral traffic in Previsible's panel, to May 2026.
- Direction: ChatGPT's share of AI referral traffic fell from 89.2% to 81.4% between Q4 2025 and Q1 2026 (BrightEdge, May 2026).
- Conversion, retail: AI retail visitors convert at a 60% higher rate than non-AI traffic (Adobe, August 2026).
- Conversion, product pages: AI-referred shoppers on a product page converted about 80% better than shoppers referred by organic search (Shopify, August 2026).
Two derived numbers frame the rest. The highest and lowest share panels sit 5.4 times apart (1.08 / 0.2), and ChatGPT's share spans 29.8 points (92.4 - 62.6). For the ranking-impact side of AI search, the parent hub on ai seo impact ranking statistics covers what these visits do to rankings.
AI referral traffic statistics: what share of visits come from AI?
AI platforms sent between 0.2% and 1.08% of website visits in the four panels below, a 5.4-fold spread that comes from sample, window and denominator. So a typical site gets somewhere between 0.2% and 1.08% of its traffic from AI chatbots, depending on the panel you resemble.
That is a different question from whether sites are getting less traffic because of AI. Referral share counts visits AI sends; it doesn't count organic clicks lost in Google, which google ai overviews statistics covers.
The 5.4 is 1.08 divided by 0.2. Between Ahrefs' broad panel and Conductor's enterprise panel the gap is 3.9-fold (1.08 / 0.28). The AI traffic share of website traffic is a ratio, and each panel counts a different set of sites over a different stretch of months. The panels don't disagree about AI. They measure different populations.
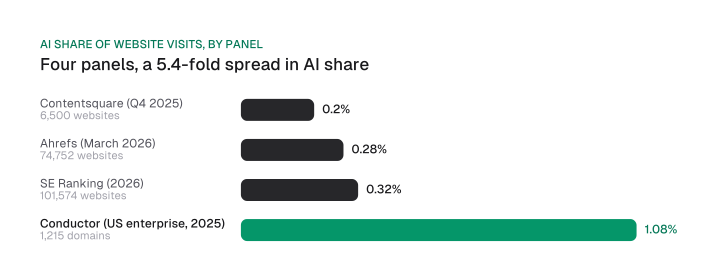
The 1.08% most pages quote is not a 2026 reading. Conductor's own methodology says the benchmarks average monthly US data over a five-month period, May 2025 to September 2025, even though the page was last updated in July 2026. It is also the highest figure of the four, because the sample is enterprise customers.
Broad Google Analytics panels read lower: 0.28% at Ahrefs and 0.32% at SE Ranking. On the Ahrefs panel Google sent a 28.12% share in March 2026 (the article does not name the base, and a later line gives 30.53% for the same month), about 100 times the AI chatbot share (28.12 divided by 0.28).
SE Ranking's series also moves. AI search engines sent 0.3511% of all website traffic in October 2025, the highest point in its dataset, so the 2026 average of 0.32% sits about 9% below that peak (0.32 / 0.3511 - 1 = -8.9%, with 0.32% rounded). Contentsquare adds that its 0.2% was up 632% year over year.
Which industries get the most AI referral traffic?
Information technology had the highest AI referral share in Conductor's panel at 2.80%, and Communication Services had the lowest at 0.25%.
The Previsible rows use a different base. Health was the only vertical where AI penetration declined, from 0.23% to 0.17%. The publisher 0.08% is measured against organic sessions, so you can't set it beside a share of total visits. More on that in the denominator rule below.
To compute your own share the way these panels do, the walkthrough in ai search analytics covers the GA4 side.
Is AI referral traffic growing?
AI referral traffic is growing, but the monthly rate depends on the window: 13.6% a month compounded from November 2024 to May 2026 on one panel, about 4.2% a month in early 2026 on another, and 1% a month in a 2025 window.
Previsible's fixed panel is the cleanest of the three. All 166 properties were present for the full 19-month window, so the 9.9x rise reflects behavior change and not new sites joining. Spreading the 9.9x evenly over the monthly steps between the two endpoints gives 13.6% a month, the compound monthly growth of the panel. This is growth in the panel's total LLM sessions, not per-site growth.
Download CSV (CC BY 4.0)
The SE Ranking rows compound each endpoint change over the three monthly steps from January to April. Within the same January to April window, ChatGPT sent 0.2286% of all web traffic in January and 0.2321% in April. So total AI traffic grew while the biggest platform barely moved. If you track only ChatGPT, you'll read that window as flat.
A straight line fits none of this. If you've seen "1% a month" quoted, that's Conductor's 2025 average, and it sits next to a 13.6% panel and a 0.5% one.
Volatility is the larger planning risk. Previsible saw monthly sessions fall 50% in a single month in November 2025, driven almost entirely by ChatGPT (448,412 sessions in October, 213,345 in November). SE Ranking saw ChatGPT's referral share jump from 0.23% in April 2026 to 0.32% in May, a 36.7% rise in one month.
If you report AI growth to your team, plan for swings of -50% and +36.7% in a month, and read any trend line with its window in hand. The click-loss side of the story, where Google's own answers take visits, is a separate measurement from referral share, so don't net the two.
Brainlabs' 54-client panel shows both sides at once. From January 2025 to April 2026, sessions across its 54 clients fell 10.5% (140.1 million to 125.4 million) while sessions from AI platforms rose 163% (Digiday, August 2026).
Which AI platform sends the most referral traffic?
ChatGPT sends the largest share of AI referral traffic in every panel here, but that share reads 62.6% to 92.4% depending on the panel, and one panel shows it rising while three show it falling.
If you need ChatGPT user counts, start with the usage side on chatgpt statistics. This section asks only what slice of AI referrals ChatGPT owns.
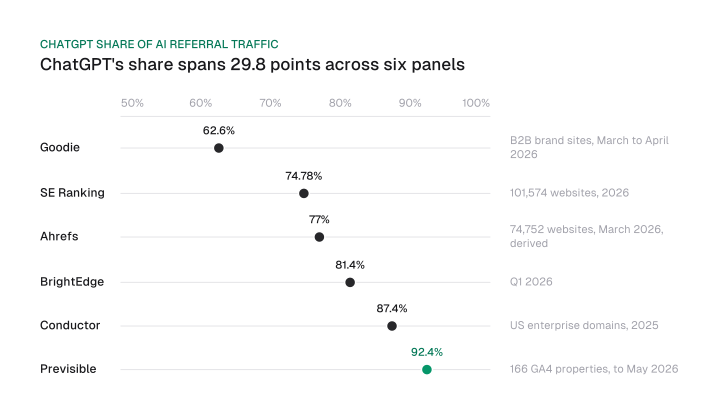
The 29.8-point spread (92.4 - 62.6) is a measurement spread. The Ahrefs figure is derived: its 2.7 million ChatGPT visitors over 3.5 million AI chatbot visitors is about 77%, with both inputs rounded.
Why do the panels differ? Weighting is one likely contributor, though that is inference. Goodie averages per brand so each brand counts equally, which gives small B2B sites the same vote as large ones. Pooled panels weight by sessions, so a few large ChatGPT-heavy sites dominate the total.
Scope matters too. Previsible's panel excludes AI Overviews, and its share is of trackable LLM referral traffic only. Use the panel nearest your site type and report direction rather than level.
For example, if you run a B2B brand site, Goodie's 62.6% is your nearest reference, and its fall from 89.1%, measured against an earlier wave on a different brand panel, is a direction signal and not a like-for-like change.
In BrightEdge's data, Gemini nearly tripled from 4.3% to 11.6% of AI referrals in Q1 2026 while ChatGPT slipped, and it reached 13.2% in April. Goodie's B2B panel gives Claude 18.5%, Gemini 10.6% and Perplexity 7.3%. If you want each challenger's own numbers, see perplexity ai statistics and claude ai statistics.
Does AI referral traffic convert better than organic search?
AI referral visitors convert better than the comparison group in every study here, by 1.5 to 3 times in four studies and 23 times on one site, and each multiple is against a different group, so the rows cannot be averaged.
So does AI search traffic convert better than Google traffic? Yes, in every study here, by 1.5x to 23x depending on what you compare against. Adobe's retail study, for example, puts AI visitors at a 60% higher conversion rate than non-AI traffic. There are still few of those visits, so the lead sits on a small base.
None of these studies states why AI visitors convert better. They measure the gap, not its cause. A plausible reading is that people arrive further along in their decision, but it's a hypothesis, so don't build a forecast on it.
The ladder below puts each multiple beside its base. If you're comparing it with your own report, read the base column first. For example, Shopify's 1.8x is against organic search on product pages, so you can't set it beside Adobe's 1.6x against everything else.
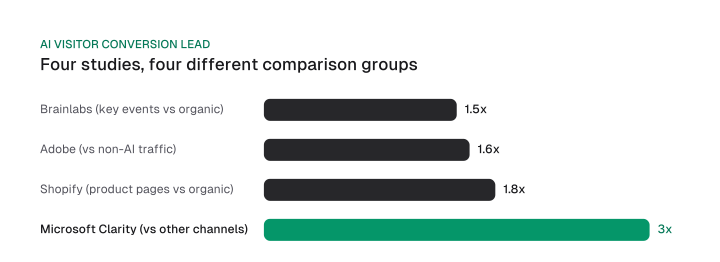
The multiples for Adobe and Shopify are derived from percentages: 1 + 0.60 gives 1.6x and 1 + 0.80 gives 1.8x. The 23x belongs to Ahrefs' own site, where AI visitors were 0.5% of visitors but 12.1% of signups; it's left off the figure because it's a single-site outlier, so don't quote it as a typical lift.
No blended premium appears here, because an all-visits base and an organic-search base answer different questions. Each row is a separate conversion premium. When you compare your own conversion rate, use the base your own report gives you.
Is AI search replacing Google for ecommerce? Nothing here shows it. On the Ahrefs panel of 74,752 websites, Google still sent about 100 times the visits that all AI chatbots combined did.
The absolute rate tells a calmer story. Contentsquare put the conversion rate of AI-referred traffic at 1.3%, just above organic social at 0.7% (Contentsquare, January 2026). So a high multiple can sit on a small base. The formula for your own rate is in our ai referral traffic tracking guide.
Landing pages explain part of the gap. SE Ranking found that 60% of AI-referred visits land on homepages against 17% from organic search, a 3.5x ratio (60 / 17).
Similarweb saw ChatGPT homepage referrals rise from roughly 26% to 29% before an update to about 62% to 63% by late May 2026, and the full table of ChatGPT landing pages lives on the usage page.
Why does AI referral traffic look smaller in analytics than it is?
Referral figures are floors, because a click that loses its referrer can't be credited to AI, and Google's own AI surfaces are counted as organic search.
Every share above counts only clicks that kept a referrer. GA4 files a visit under Direct when its source is "(direct)", the channel Google describes for a saved link or a typed URL. When the referrer is stripped from an app click and the link carries no UTM tag, it has no other source to show, so it lands in Direct traffic and no AI panel sees it.
Google's GA4 documentation defines the AI Assistant channel as visits from sources like ChatGPT, Gemini, Deepseek, Copilot or Grok, and says it excludes Google's AI Overviews and AI Mode. Organic Search, by the same documentation, includes those two surfaces. Gemini mentions that send no click never show up in referral reports; gemini visibility tracker tools measure them with a fixed prompt panel.
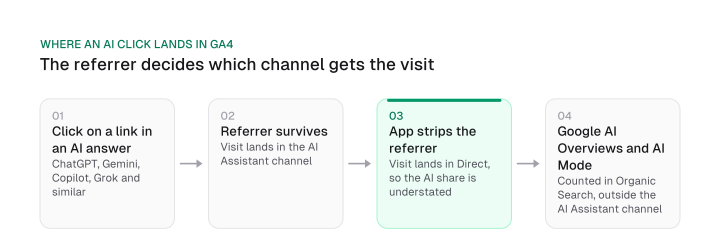
The consequence is uneven. If a platform's users click mostly from apps, every share table here understates it, so you can't trust the ranking among challengers either. And no AI assistant referral share includes Google's AI surfaces at all.
Gemini is a live example of the problem. Search Engine Journal reported on 1 October 2026 that Google had just added UTM parameters to outgoing Gemini links, so site owners can attribute those referrals more accurately. Google has not documented it, and which interfaces it covers is unknown, so older Gemini figures predate the fix.
Citations are a separate gap. An AI answer can name your brand without anyone clicking, so presence and visits diverge; ai citation statistics covers citation presence.
If you want bot requests instead of human visits, the data on ai crawlers has them. For GA4 setup, see the GA4 setup guide.
Which AI referral benchmark should you compare your site against?
Compare your AI share only after restating it on the panel's denominator, then pick the panel whose population resembles your site.
Here is the rule:
- Name the panel's denominator. Total visits, referral sessions or organic sessions. The panel table above lists it per row.
- Restate your share on that denominator. Divide your AI sessions by the same base the panel used, not by whatever your dashboard defaults to.
- Match the sample type. Enterprise domains, broad Google Analytics sites, retailers, B2B brand sites or publishers.
- Then compare to the band. Read your number against that panel's figure, with its window.
Can you use these numbers in a business case? Yes: cite one panel, with its denominator and window, for example "0.32% of all website traffic across 101,574 websites, January to April 2026 (SE Ranking)", and never mix a share of total visits with an organic-session figure.
Previsible's publisher 0.08% shows why step 1 matters. It is measured per organic session, so if you run a publisher site and read it against a 0.32% share of total visits, you'll conclude the wrong thing.
Referral numbers are floors, as the previous section showed. So when you size AI work, size it on the bands and the undercount, and treat referral sessions as the minimum.
AI referral traffic statistics that do not hold up
Four AI referral readings fail a trace: two different 0.32% values from one vendor, two 2026 ChatGPT shares that differ by window, a publisher figure counted per organic session, and an Adobe +62% that is growth in AI's share of retail visits.
These are the numbers that do not hold up until you state which study, which window and which denominator they come from.
-
Two 0.32% values. SE Ranking printed 0.32% for all AI platforms in its January to April 2026 study, and 0.32% for ChatGPT alone in its May 2026 study. Its own words in the first: "AI platforms now account for 0.32% of all website traffic, up from 0.24% in 2025 and 0.02% in 2024." In the second: "ChatGPT's referral share rose from 0.23% in April to 0.32% in May." Same digits, different quantity.
-
Two 2026 ChatGPT shares. The same vendor's ChatGPT share is 74.78% in the January to April study and 75.96% in the January to May study. That's a window difference, so if you see both numbers quoted, they don't conflict. Both say the share fell from 79.74% in 2025.
-
A per-session publisher figure. Previsible puts publisher penetration at 0.08% when measured against its panel's organic sessions. It isn't a share of visits, so you shouldn't put it next to the shares in the panel table.
-
Adobe's +62%. Adobe's report lists "visit share growth in July (+119% YoY) followed by Retail (+62% YoY)". Adobe's chart is titled "Growth in AI Visit Share by Industry", so the +62% is growth in AI's share of retail visits (Travel +119%). Another slide in the same report calls these figures an "AI traffic boost", so quote it as a share and say so.
The separate correction of the 87.4% ChatGPT figure is on ai seo statistics, which uses Goodie's panel. The finding here moves differently: 87.4% is one of six points on the spread, and Previsible's panel moves the other way.
How these AI referral traffic statistics were checked
How these numbers were checked: every figure was read on the page its link names in October 2026, and ratios are computed from the inputs shown beside them.
The comparison covers published panels from Conductor, Contentsquare, Ahrefs, SE Ranking, Previsible, BrightEdge, Goodie, Adobe, Shopify, Brainlabs, Microsoft Clarity and Similarweb, plus Google's GA4 channel definitions. Derived numbers show their formula in the sentence.
What is not comparable: panels differ in sample, window, denominator and weighting, which is the point of this page. Previsible's AI figures exclude AI Overviews. Gemini's October 2026 change is reported, not documented by Google.
How old is each panel? The table sets each panel's last month of data beside the date on its page:
Download CSV (CC BY 4.0)
The highest share on this page is also the oldest reading. Conductor's 1.08% comes from a window that closed in September 2025, a full quarter before any other panel's data ends, and a July 2026 page date doesn't make it newer. So if you quote 1.08%, say it describes mid-2025 enterprise traffic.
We did not measure AI referral traffic ourselves and give no figure of our own. The newest windows here close in May 2026 or earlier, so expect these panels to move.
AI referral traffic has many benchmarks, not one. Before your next report, restate your AI share on the denominator of the panel closest to your site and quote the figure with that panel's name beside it.
Frequently asked questions
What percentage of website traffic comes from AI?
AI platforms send between 0.2% and 1.08% of website visits depending on the panel: 0.2% at Contentsquare, 0.28% at Ahrefs, 0.32% at SE Ranking and 1.08% at Conductor. The spread comes from sample and window. See the panel table above to match your site type.
What percentage of AI referral traffic is ChatGPT?
ChatGPT's share is 62.6% in Goodie's brand-averaged B2B panel, 74.78% at SE Ranking, about 77% at Ahrefs, 81.4% at BrightEdge, 87.4% at Conductor and 92.4% at Previsible. Three panels show it falling and Previsible shows it rising.
Does AI referral traffic convert better than organic?
Yes in every study here: 1.5 times (Brainlabs), 1.6 times (Adobe, against non-AI traffic), 1.8 times (Shopify) and 3 times (Microsoft Clarity), each against a different base. Contentsquare's absolute rate for AI-referred traffic is 1.3%, so the multiples sit on a small base.
Is my AI referral traffic undercounted in Google Analytics?
Yes. App clicks that arrive without a referrer or a UTM tag can only show up as Direct, and Google's AI Overviews and AI Mode count as Organic Search, not the AI Assistant channel. Treat any AI referral share as a floor.
Is AI referral traffic growing or declining in 2026?
It is growing on most panels: 13.6% a month in Previsible's fixed panel, about 4.2% a month at SE Ranking in early 2026. It is also volatile. Previsible logged a 50% one-month fall in November 2025, and SE Ranking saw ChatGPT's share rise 36.7% in May 2026.
How do I see AI referral traffic in GA4?
Look at the AI Assistant default channel group and check Direct for app clicks that lost their referrer. The full setup, with the formulas for your own conversion rate, is in our AI search analytics walkthrough.
Cite this page
Aktaş, F. (2026, October 17). AI Referral Traffic Statistics 2026: 0.2% to 1.08% of Visits. Mission Growth. https://missiongrowth.io/blog/ai-referral-traffic-statistics
Download the data: 6 tables as CSV (CC BY 4.0)
- AI share of website visits by panel, 2025 to 2026
- AI referral share by industry or vertical, Conductor and Previsible panels
- AI referral traffic growth by panel and window, converted to monthly rates
- ChatGPT share of AI referral traffic by panel, 2025 to 2026
- AI referral conversion premium by study and comparison base, 2026
- AI referral traffic panels by last month of data and page date, as of October 2026
Figures we made for this post are free to reuse under CC BY 4.0 with credit to Mission Growth.
Get Mission Growth highlighted in your Google results.