Perplexity AI Statistics 2026: Revenue, Users, Valuation
Perplexity AI statistics for 2026: revenue, users, queries per month and valuation, the figure to quote for each, and four repeated numbers to caveat.
By Ömer Furkan AktaşPublished
On this page
Perplexity AI statistics are easy to find and hard to trust, because "users", "revenue" and "valuation" each name several different quantities. The figures that hold are 780 million queries in May 2025 (stated by its CEO), more than 100 million monthly active users from search and agent tools (Financial Times, April 2026) and $20 billion at the last disclosed priced round (September 2025).
The open question is traffic. Perplexity's share of AI traffic is falling while its annual recurring revenue rises, and the panels that count absolute referral traffic disagree with each other.
In these Perplexity statistics, each question gets one figure to quote, what it counts and when it was true. Four numbers that circulate widely get a caveat instead.
Last verified: October 1, 2026.
Perplexity AI statistics at a glance
Perplexity AI statistics that hold up are 780 million queries in May 2025, over 100 million monthly active users in April 2026, ARR above $450 million in March 2026 and a $20 billion last priced valuation.
Here are the ten key figures you can copy alone, each with its basis:
- Queries: Perplexity processed 780 million queries in May 2025, TechCrunch reported from CEO Aravind Srinivas's Bloomberg Tech Summit remarks.
- Daily volume: The same remarks put the June 2025 run rate at about 30 million queries a day.
- Users: Perplexity has more than 100 million monthly active users from its search and agent tools, as the Financial Times reported in April 2026 (via PYMNTS).
- ARR: Perplexity's estimated annual recurring revenue (ARR) topped $450 million in March 2026, per the same Financial Times report.
- Latest ARR estimate: Sacra estimates $750 million in annualized revenue for August 2026.
- Valuation: Perplexity's last disclosed priced round was $200 million at a $20 billion valuation in September 2025, as Reuters reported from The Information.
- Price: Comet Plus costs $5 a month standalone and is included with Pro and Max, per Perplexity's announcement in August 2025.
- Referral share: SE Ranking put Perplexity at 7.23% of AI referral traffic across 101,574 websites in 2026.
- Lowest reading: Previsible's May 2026 counts across 166 GA4 properties, 6,788 Perplexity sessions out of 644,478 LLM referral sessions, give 1.05% by our division.
- Growth: Query volume grew about 10.0% a month between October 2024 and May 2025, by our calculation from two CEO statements.
Four commonly repeated figures need a caveat: 230 million monthly users, a $22.6 billion valuation, a "revenue" label on ARR figures, and query totals with no company statement. The caveats section below says what each source actually states. For the ranking-impact side of AI search, see our ai seo statistics roundup.
How many people use Perplexity?
Perplexity users number more than 100 million a month on search and agent tools, per the Financial Times in April 2026. No company source gives the 230 million that also circulates.
Three user numbers compete, and which number to quote depends on what each one counts:
| Figure | What the source says it counts | Source | As of | Quote it when |
|---|---|---|---|---|
| More than 100 million | Monthly active users from search and agent tools, a floor | Financial Times, citing company executives | April 2026 | You need a company-sourced reach figure. Keep "more than" and "search and agent tools". |
| 45 million | Active users on "website and app", framed as growth from 22 million at the start of 2025 | A 2026 roundup | July 2026 | You attach its wording. How its basis differs from the 100 million figure (date, scope or both) is unknown. |
| 230 million | Global monthly active users, labelled "Perplexity reported" | A UK agency's 2026 report | March 2026 | Never. Its companion figures do not hold together. |
Download CSV (CC BY 4.0)
If you need one number for a deck, use the first row and write its wording as the source did. The second row is a different count, and nothing public tells you how far apart they are.
The 230 million report fails a consistency test. It lists 18.4 million Pro subscribers at an average $8 a month per user. The implied annual revenue is $1.77 billion.
That is 3.9 times the ARR the Financial Times reported (18.4 million subscribers, 8 dollars a month, 12 months).
Free promotional Pro accounts could inflate the subscriber count, so this does not prove the 230 million wrong. It shows the report's figures cannot be reconciled with each other. And 230 million is 2.3 times the 100 million floor.
India shows how a distribution deal moves a user number. Bharti Airtel's July 2025 partnership gave all 360 million Airtel customers 12 months of Perplexity Pro at no cost. Sacra's series has India's monthly active users rising from about 2.6 million in the first half of 2025 to a peak of 22 million in October 2025, then nearly 14 million in July 2026.
So when you read any national or global user figure, ask whether a promotional cohort sits inside it. If you are deciding between engines on reach alone, the ai search engines comparison puts these counts next to the other platforms.
Perplexity AI statistics by country
Perplexity AI statistics by country come from panels and from Sacra, so each reading answers a different question.
| Reading | Measure | Value | Period |
|---|---|---|---|
| United States | Share of visitors, Similarweb panel via a 2026 roundup | 20.09% | Undated |
| India | Share of visitors, same panel | 11.01% | Undated |
| Germany | Share of visitors, same panel | 5.36% | Undated |
| India | Monthly active users, Sacra | About 2.6 million | First half of 2025 average |
| India | Monthly active users, Sacra | 22 million | October 2025 peak |
| India | Monthly active users, Sacra | Nearly 14 million | July 2026 |
The roundup's table header calls the panel figures users, while its sentence calls them visitors, and it gives no date. A different panel disagrees:
Semrush's August 2026 country split lists the United States at 16.05%, Bangladesh 10.46% and India 7.19%.
Never quote one country share as the answer. The one country story that holds across sources is India's Airtel spike and its partial fall.
How many queries does Perplexity handle per month?
Perplexity queries per month reached 780 million in May 2025, per its CEO, who put June 2025 at about 30 million a day. No later company figure is verified.
The timeline below joins statements from different talks:
| Period | Queries | Basis | Source |
|---|---|---|---|
| First day, 2022 | 3,000 | Stated as the first-day volume | TechCrunch |
| July 2024 | 250 million a month | Stated monthly volume | Yahoo Finance |
| October 2024 | 100 million a week, roughly 400 million a month | Weekly statement, extrapolated to a month | Yahoo Finance |
| May 2025 | 780 million a month | Monthly total | TechCrunch |
| June 2025 | About 30 million a day | Run rate | TechCrunch |
Download CSV (CC BY 4.0)
The 780 million is May's total and the 30 million a day is a June run rate. Don't multiply one into the other.
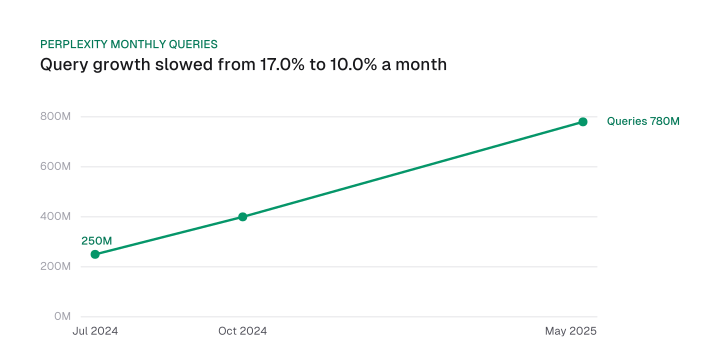
Did growth match the "20% a month" claim? Srinivas said Perplexity was seeing more than 20% growth month over month, and added: "Give it a year, we'll be doing, like, a billion queries a week if we can sustain this growth rate."
Our test uses the CEO's own numbers. Volume grew about 17.0% a month between the July and October 2024 statements, then about 10.0% a month between October 2024 and May 2025.
A billion queries a week means a billion times 52 weeks, divided by 12 months, which sets the monthly target. At the quoted 20%, you get there in about 9.4 months from May 2025. At the 10.0% rate it takes about 18.0 months.
Baseline choice matters a little. On a 433 million October baseline (100 million x 52 / 12 instead of the source's 400 million), the later rate is 8.8% and the wait 20.4 months.
Treat these rates as averages between soundbites. They join one weekly and one monthly statement from different talks, so they are not a measured growth rate. The latest query count verified for this page is May 2025's.
How much revenue does Perplexity make?
Perplexity's annual recurring revenue (ARR) topped $450 million in March 2026, per the Financial Times, and Sacra estimates $750 million for August 2026.
ARR is a run rate: it annualises current revenue and says nothing about what the company earned over a year. The ARR series is one metric on five dates:
| As of | ARR | Source | Produced by |
|---|---|---|---|
| 2025 | $148 million | A 2026 roundup, "latest data in 2025" | Roundup |
| October 2025 | $200 million | A February 2026 report | Report |
| End of 2025 | $232 million | Sacra | Estimate |
| March 2026 | More than $450 million | Financial Times, via PYMNTS | Reported from figures seen by the FT |
| August 2026 | $750 million | Sacra | Estimate |
Download CSV (CC BY 4.0)
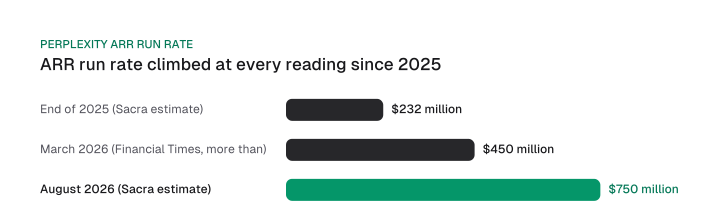
Between the points, ARR grew about 7.7% a month from October to December 2025, 24.7% a month into March 2026 and 10.8% a month into August 2026. Two of those rates join a Sacra estimate to a Financial Times figure, so read them as rough.
Sacra attributes the 2026 growth to the February 2026 launch of Computer, its agent product, plus a usage-based pricing layer on top of existing subscriptions.
One recognised-revenue label exists in this set: a 2026 roundup says Perplexity generated $80 million in revenue last year. Keep it apart from the ARR rows. A run rate and a year of recognised revenue are different quantities.
A conflict also needs flagging. A July 2026 roundup says annualised revenue stays at $450 to $500 million in Q2 2026 and gives no source. Sacra says $750 million in August 2026.
Public sources cannot reconcile the two, so quote Sacra's figure as an estimate and the Financial Times figure as reported.
What is Perplexity's valuation?
Perplexity's last disclosed priced round was $200 million at a $20 billion valuation in September 2025, per Reuters.
Here is the valuation trail:
| Date | Round | Valuation | Source |
|---|---|---|---|
| July 2025 | Tranche attributed to Bloomberg | $18 billion | Sacra |
| September 2025 | $200 million, priced | $20 billion | Reuters, from The Information |
| December 5, 2025 | Angel round, amount undisclosed | Not stated | Tracxn |
| January 9, 2026 | No disclosed round | $22.6 billion, profile figure | Tracxn |
Download CSV (CC BY 4.0)
The $22.6 billion figure circulates in roundups as a "Series E-6" round in January 2026. It appears on a Tracxn profile as a post-money valuation as on January 9, 2026.
But Tracxn's own latest round is the undisclosed angel round on December 5, 2025, and its priced round is the $20 billion one. No disclosed round carries $22.6 billion. That doesn't rule out a secondary or an undisclosed round, but nothing public traces the number.
The last priced round is the one to quote. Quote the Perplexity valuation as $20 billion, dated September 2025.
Call $22.6 billion a profile figure with no disclosed round.
Is Perplexity losing users?
Perplexity's share of AI traffic is falling on every share-based panel here, while its ARR kept rising; whether its absolute referral traffic fell depends on the panel.
The question "is Perplexity losing users" uses the wrong frame, because the market grew faster than Perplexity did. The table keeps each measure beside its own kind:
| Block | Measure | Period | Direction | Magnitude | Sample |
|---|---|---|---|---|---|
| Company-side | Monthly queries | July 2024 to May 2025 | Up | 250 million to 780 million | CEO statements |
| Company-side | ARR run rate | End of 2025 to August 2026 | Up | $232 million to $750 million | Sacra estimates |
| Company-side | India monthly active users | October 2025 to July 2026 | Down | 22 million to nearly 14 million | Sacra |
| Share of a pool | StatCounter chatbot referral share | May 2025 to May 2026 | Down | 11.83% to 7.67%, -35% | StatCounter |
| Share of a pool | SE Ranking US AI referral share | First four months of 2025 to 2026 | Down | 19.73% to 6.85%, -65% | SE Ranking, 101,574 sites |
| Share of a pool | Web traffic share (Similarweb, via a roundup) | March to May 2026 | Down | 2.0% to about 1.3% | Similarweb |
| Share of a pool | US daily active share (Apptopia, via a roundup) | October 2025 to April 2026 | Down | 6% to 2.1% | Apptopia |
| Absolute traffic | Referral sessions | March 2025 to May 2026 | Down | 17,507 to 6,788, -61% | Previsible, 166 GA4 properties |
| Absolute traffic | Share of total website traffic | 2025 to 2026 average | Roughly flat | 0.0245% to 0.0230%, about -6% | SE Ranking, 101,574 sites |
Download CSV (CC BY 4.0)
Read down the share rows and the direction is uniform. Perplexity's slice of AI referral traffic shrank on StatCounter, on SE Ranking's US data, and on the Similarweb and Apptopia readings relayed by a July 2026 roundup.
The SE Ranking study reports its US referral share and the Apptopia reading is a US daily active share. They are different quantities, so never combine them.
The absolute readings disagree. Previsible's 166-property panel finds referral sessions down 61%. SE Ranking's 101,574-site panel measures Perplexity's share of all website traffic, which tracks visit volume more closely than a share of the AI pool does, and finds it nearly flat at about -6%.
The sample is the claim here. Don't set a share drop beside an absolute drop as if they agreed. They measure different things.
Semrush's August 2026 visits reading is left out. A site-visit metric omits app and agent use.
You can settle the question for your own site faster than the panels can. Look at your Perplexity referral sessions in your analytics, and if you want a method, track perplexity rankings alongside them.
How much traffic does Perplexity send to websites?
Perplexity's share of AI referral traffic runs from 1.05% to 11.83% depending on study and month, and PerplexityBot had the lowest crawl-to-refer ratio of the major AI platforms in 2025.
The studies differ in sample and metric, so line them up before you compare:
| Study | Metric | Sample | Window | Perplexity value |
|---|---|---|---|---|
| StatCounter | Chatbot referral share | Its network | May 2025 | 11.83% |
| StatCounter | Chatbot referral share | Its network | May 2026 | 7.67% |
| SE Ranking | AI referral traffic share | 101,574 websites | January to April 2026 | 7.23% |
| Previsible | Share of LLM referral sessions (our division of 6,788 by 644,478) | 166 GA4 properties | May 2026 | 1.05% |
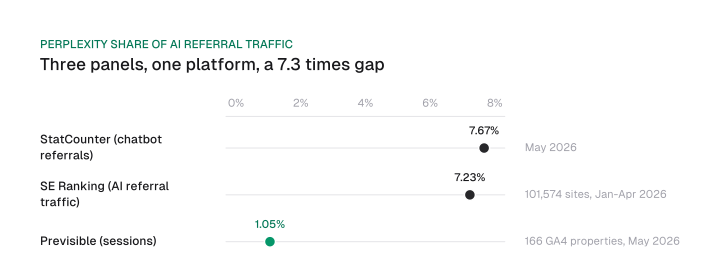
In the same month, May 2026, StatCounter's 7.67% and Previsible's 1.05% differ by 7.3 times. Samples differ and the metrics differ: chatbot referrals against LLM sessions.
Within each panel the share trend is consistent. StatCounter's share fell 35% and SE Ranking's US share fell 65%. Absolute traffic is where they split: Previsible shows sessions down 61%, SE Ranking about 6%.
So the fair summary is a falling share of a growing pool, with absolute traffic unsettled. If you want to know why panels disagree on your own numbers, ai referral traffic tracking starts with separating sessions from shares.
Cloudflare adds a mechanism. Its crawl-to-refer ratio divides HTML requests from a platform's crawler user agents by HTML requests whose Referer header carries that platform's hostname.
A low ratio therefore means more visits arrive per crawl. It does not mean large absolute traffic. In Cloudflare's 2025 year in review, Perplexity had the lowest ratio of the major AI platforms. It started the year below 100:1, spiked above 700:1 in late March alongside a PerplexityBot crawl spike, and stayed below 200:1 from September onwards.
Anthropic's ratio reached as much as 500,000:1, and OpenAI's as much as 3,700:1 in March. Perplexity sends the most visits per crawled page of the three, which still says nothing about how many visits that is. Anthropic's own usage and revenue are in our Claude statistics.
Where the Comet Plus 80/20 and $42.5 million figures come from
Perplexity's August 2025 Comet Plus announcement states neither an 80/20 split nor a pool; it distributes all revenue to publishers minus a small portion for compute costs.
In its own words, Perplexity is "distributing all of that revenue to participating publishers, minus a small portion for Perplexity's compute costs." It allocates revenue on three traffic types: human visits, search citations and agent actions.
The two numbers that circulate come from statements and reporting around the launch:
| Figure | Where it appears | Who is named as stating it |
|---|---|---|
| All revenue minus a small portion for compute | Perplexity's announcement | Perplexity |
| 80% to publishers, 20% to compute | Windows Central | "Perplexity claims" |
| 80 percent to publishers, 20 percent to compute | Engadget | "According to Perplexity" |
| $42.5 million revenue pool | Windows Central | Bloomberg |
| $42.5 million revenue pool | Engadget | The Wall Street Journal |
Download CSV (CC BY 4.0)
Quote both as what Perplexity told the press, because the announcement itself holds neither. Write "Windows Central reports Perplexity claims 80%", or "Bloomberg and the Wall Street Journal are cited for a $42.5 million pool".
The earlier 2024 program worked differently. The Perplexity Publishers' Program launched on July 30, 2024 with six partners and paid a share when a publisher's content was referenced in an interaction that earned Perplexity revenue. That tied it to advertising, and a February 2026 report says ads were phased out by late 2025.
On price, Comet Plus is $5 a month.
Perplexity's subscriptions run from twenty to two hundred dollars a month. For payout history and how to earn citations, read the perplexity publishers program guide.
Perplexity figures that need a caveat
Four widely repeated Perplexity figures need a caveat: 230 million monthly users, a $22.6 billion valuation, a "revenue" label on ARR figures and query totals with no company statement.
Each one has a mechanical cause:
| Circulating figure | Where it circulates | What the source says | Write instead |
|---|---|---|---|
| 230 million monthly users | A UK agency's 2026 report | Labelled "Perplexity reported"; its subscriber and ARPU figures imply 3.9 times the reported ARR | More than 100 million monthly active users from search and agent tools (Financial Times, April 2026) |
| $22.6 billion valuation | 2026 roundups | A Tracxn profile figure; no disclosed round carries it | $20 billion at the last disclosed priced round, September 2025 |
| "Revenue" of $450 to $500 million | A July 2026 roundup | Annualised revenue, no source given | ARR above $450 million, March 2026 (Financial Times); Sacra's $750 million as an estimate |
| Query totals for 2025 and 2026 | Two 2026 roundups | No company statement | 780 million queries in May 2025, per the CEO |
Download CSV (CC BY 4.0)
The 80/20 and $42.5 million figures are not in this table. Perplexity stated them to the press, so they are dated claims you can quote with attribution.
The table's row on revenue labels is about the label. ARR is a run rate. The only recognised-revenue figure in this set is the roundup's $80 million for last year, which belongs to a different quantity.
How these Perplexity statistics were checked
Figures from Perplexity's own posts or its CEO's statements are quoted from those; press-reported figures say so, and estimates are labelled estimates.
This page compares published figures as of October 1, 2026. It makes no first-party measurement of Perplexity's usage or traffic, and derived numbers show their formula next to them.
Before you quote any Perplexity number, ask three questions:
- Who said it? A company statement, a press report of one, a panel measurement or a profile all carry different weight.
- What does it count? Monthly active users, visitors and sessions differ, and so do ARR, annualised revenue and recognised revenue.
- As of when? The ARR series spans five dates, and the gap between 45 million and 100 million users may be a date gap.
Each caveat above fails one of these. The 230 million figure and the "revenue" label fail "what does it count". The $22.6 billion and the unsourced query totals fail "who said it". If you cannot answer all three, write the figure with its source and month or leave it out.
The thesis in one line: Perplexity's headline numbers mix incompatible bases, and compared only against the same metric, ARR and queries rose while its share of AI traffic fell. Next time you cite Perplexity, run those three questions on the number first.
Frequently asked questions
Is Perplexity losing users?
Perplexity's share of AI traffic is down on every share-based panel here, including StatCounter and SE Ranking, while its ARR kept rising. Absolute referral traffic depends on the panel: Previsible finds sessions down 61%, SE Ranking about 6%. Compare only same-metric figures.
How many queries does Perplexity get per day?
About 30 million a day, the CEO's June 2025 run rate, following the May 2025 total of 780 million. No later company figure is verified. Don't multiply the daily rate into a monthly total, because the two come from different statements.
What is Perplexity valued at?
The last disclosed round is $200 million at $20 billion in September 2025, per Reuters. A $22.6 billion figure circulates from a Tracxn profile, but no disclosed round carries it.
How much revenue does Perplexity make?
Perplexity's estimated ARR topped $450 million in March 2026, per the Financial Times, and Sacra estimates $750 million for August 2026. ARR is an annual run rate, not revenue earned in a year, and a roundup's $80 million is a separate recognised-revenue label.
Which countries use Perplexity most?
Panels disagree. A Similarweb panel relayed by a 2026 roundup puts the United States at 20.09% of visitors and India at 11.01%, undated. India's Airtel promotion drove monthly active users from about 2.6 million to a 22 million peak in October 2025.
Figures and images in this post are free to reuse under CC BY 4.0 with credit to Mission Growth.
Get Mission Growth highlighted in your Google results.