Google AI Overviews Statistics: 9 Numbers Corrected (2026)
Google AI Overviews statistics traced to the primary study: 9 circulating numbers corrected, why rates run from 11% to 48%, and our own 58-SERP US capture.
By Ömer Furkan AktaşPublished
On this page
Google AI Overviews statistics disagree because the studies measure different things: the feature appears on between 11% and 48% of queries, depending on who counted.
BrightEdge's May 2025 press release counted over 11% of Google queries, and its February 2026 report counted about 48% of its tracked queries. In Pew Research Center's browsing panel, 18% of Google searches produced an AI summary, and visits to those pages produced a traditional-result click 8% of the time against 15% without one.
So how often do AI Overviews appear? It depends on the sample. Each study counts a different set of searches, a different unit and a different window, and the most-quoted "trends" stitch two studies together.
Every derived number below shows its formula, and each conflict ends with the number to use. If you need one figure for a slide or a story today, start with the list below.
Key Google AI Overviews statistics at a glance
The ten figures below each come from a named study or from our own dated capture, with its sample and month, and each stands alone.
- Share of searches: Pew Research Center found that 18% of the Google searches in its March 2025 panel of 900 US adults produced an AI summary.
- Tracked queries: BrightEdge measured AI Overviews on about 48% of tracked queries in February 2026, up from roughly 30% a year earlier.
- Clicks per visit: Pew's panel clicked a traditional result link in 8% of visits with an AI summary and in 15% of visits without one.
- Position one: Ahrefs measured a 58% lower average CTR for position one on keywords with an AI Overview (300,000 keywords, December 2025).
- Clicks per million impressions: Seer Interactive counted about 33,500 organic clicks per million informational impressions with no AI Overview, about 20,743 for a cited brand and about 9,445 for an uncited one (April 2026 study).
- Clicks inside the summary: Pew saw a click on a link inside the summary itself in 1% of visits to pages with one.
- Citation overlap: Ahrefs' March 2026 study put 37.9% of cited URLs in the first 10 blocks of the SERP, while its July 2025 study put 76.10% of cited pages in the top 10. Ahrefs says its parsing changed in between.
- Length and sources: Surfer's study of 405,576 AI Overviews found 157 words and 5 sources on average.
- Users: Google reported over 2.5 billion monthly active users for AI Overviews in June 2026.
- Our capture: Across 58 US Google results pages we captured between 22 September and 1 October 2026 (searches for the SEO, GEO and AI-marketing topics we research, not a random sample of US queries), 42 showed an AI Overview, which is 72.4%; the median Overview cited 7 sources, and 50.4% of the 268 cited sources were domains that also ranked in that page's organic results, or 40.7% when matched by exact URL. On 58 SERPs the 95% interval is about 60% to 82%.
Last verified: 1 October 2026. The sections below say which figure answers which question.
How often do Google AI Overviews appear?
AI Overviews show up on anywhere from 11% to 48% of queries, because each study samples a different set of searches and counts a different unit. The table lines the studies up by window, unit and sample.
| Study | Window | What was counted | Sample | Share with an AI Overview |
|---|---|---|---|---|
| BrightEdge press release | May 2025 | Google queries | Not stated in the quoted line | over 11% |
| Pew | March 2025 searches | Real searches by panel members | 900 US adults | 18% |
| Semrush | January, July and November 2025 | Keywords | 10M+ keywords | 6.49% / 24.61% / 15.69% |
| Conductor | 15 September to 12 October 2025 | Unique US Google searches | about 21.9 million searches | 25.1% |
| arXiv preprint | 13 March to 21 April 2026 | Trending queries | 55,393 queries | 13.7% |
| BrightEdge | February 2026 | Tracked queries | Tracked-query set | about 48% |
| Seer, April 2026 study | January 2025 to February 2026 | Informational queries | 53 brands, 5.47M queries | 36% |
Download CSV (CC BY 4.0)
Semrush's panel is 10M+ keywords, BrightEdge's is a tracked set of queries, the preprint (not peer reviewed) crawled trending queries, and Pew watched real people search. Conductor's 25.1% is our division: nearly 5.5 million searches with an AI Overview out of about 21.9 million.
The clean way to see the problem is to start inside one vendor. BrightEdge's May 2025 release gives over 11% of Google queries, yet its February 2026 report says its tracked queries rose from roughly 30% a year earlier to 48%. So BrightEdge's own two releases describe different sets: roughly 30% in February 2025 over 11% in May 2025 is about 2.7 times.
Now take the line you've probably seen, "seven and a half times in 15 months". It pairs Semrush's 6.49% for January 2025 with BrightEdge's 48% for February 2026, and 48 / 6.49 gives 7.4.
That 7.4-fold figure equals a 4.6-fold vendor gap between two keyword sets in early 2025 (30 / 6.49) times a 1.6-fold rise inside BrightEdge's tracked set (48 / 30, which BrightEdge calls a 58% increase). No study here follows one fixed population across both periods, so neither factor measures how much more often Google shows the feature.
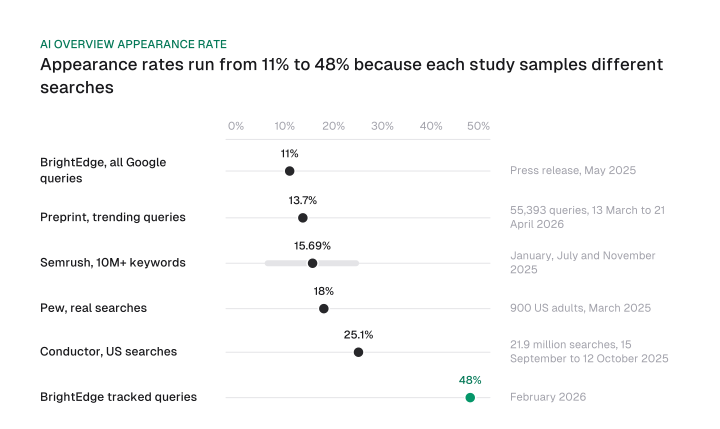
No single appearance rate exists, so the useful question is "of which searches". The rate for your site is your own query mix.
Our own capture gets a separate table, because its frame is narrow.
Across 58 US Google results pages we captured between 22 September and 1 October 2026 (searches for the SEO, GEO and AI-marketing topics we research, not a random sample of US queries), 42 showed an AI Overview, which is 72.4%; the median Overview cited 7 sources, and 50.4% of the 268 cited sources were domains that also ranked in that page's organic results, or 40.7% when matched by exact URL.
| Measure | Result | How we got it |
|---|---|---|
| SERPs captured | 58 | One capture per unique keyword, logged out, gl=us |
| SERPs with an AI Overview | 42 of 58 | AI Overview present on the page |
| AI Overview share | 72.4% | 42 / 58; 95% interval about 60% to 82% (Wilson score) |
| Cited sources in the 42 Overviews | 268 | Sum of cited links per Overview |
| Median cited per Overview | 7 | Median of cited links per Overview |
| Cited domains also in the same SERP's organic results | 135 of 268 (50.4%) | Domain equals an organic result domain |
| Cited URLs also in the same SERP's organic results | 109 of 268 (40.7%) | Exact URL equals an organic result URL |
| Domain match minus URL match | 9.7 points | 50.4% minus 40.7% |
| 24 September captures | 18 of 18 with an Overview | Every other capture day: 24 of 40 (60%) |
| Keywords of 1-2 words | 11 of 15 (73.3%) | 3-4 words: 23 of 33 (69.7%); 5 or more words: 8 of 10 (80%) |
| Dropped captures | 3 one-result captures, none with an Overview | 42 of 61 unique keywords (68.9%) with them counted |
Read the 72.4% with its frame. The set is the SEO, GEO and AI-marketing keywords we research, which makes it a topic cut of US search. One batch dominates: all 18 captures on 24 September showed an Overview, against 24 of 40 on every other day.
The keywords of 1-2 words showed one 11 of 15 times, far above Pew's 8% for one- and two-word searches. So topic, capture date, Google profile and our extractor are tangled together, and nothing here separates them. Quote the share only beside its interval, and don't set it next to the third-party rows above.
Why isn't any rate near 100%? BrightEdge says about 52% of queries still trigger no AI Overview. Google's Search Central documentation gives the reason: an AI Overview is shown only when its systems judge it additive to classic Search, so it often does not trigger.
If your keyword shows none, that is the documented behavior. It matters again in the click section, because the queries that get an Overview are a selected group.
Which searches trigger an AI Overview?
Longer, question-shaped and informational searches trigger AI Overviews far more often: four studies put the query-shape multiplier between 3.7 times and 7.2 times, and industry sets the baseline. The tables below give each cut with its study and month.
Query length and question form
Query shape moves the trigger rate by 3.7 times to 7.2 times, depending on which study and which cut you read.
| Study | Cut | Higher group | Lower group | Multiplier |
|---|---|---|---|---|
| Pew | Search length | 10 words or more: 53% | One or two words: 8% | 6.6 times |
| Ahrefs | Query length | Seven or more words: 46.4% | One word: 9.5% | 4.9 times |
| arXiv preprint | Question form | Question-form queries: 64.7% | Non-question queries: 9.5% | 6.8 times |
| Ahrefs | Question form | Question queries: 57.9% | Non-question queries: 15.5% | 3.7 times |
| Seer | Intent | Informational: 36% | Transactional: 5% | 7.2 times |
Download CSV (CC BY 4.0)
Each multiplier divides the two extreme groups of one study, so it is a ceiling contrast. It does not average over all queries. The two smaller panels, Pew's 900 adults and the preprint's trending queries, read 6.6 times and 6.8 times, while Ahrefs' 146 million desktop SERPs from September 2025 read 4.9 times and 3.7 times.
The baselines differ too: Pew's 18% of searches, Ahrefs' 21% of keywords, the preprint's 13.7%. That is why you quote a study together with its ratio and never "the" multiplier. Seer adds that comparison and question queries trigger an AI Overview on more than 85% of informational searches, a share inside one intent, so it sits outside the table.
Search intent
Informational queries make up most AI Overview queries in both vendors' data, but the shares differ widely: 99.9% in Ahrefs' September 2025 data against 57.1% in Semrush's October 2025 data.
| Intent | Share of AI Overview keywords (Ahrefs, September 2025, labels overlap) | Share of AI Overview queries (Semrush, October 2025) |
|---|---|---|
| Informational | 99.9% | 57.1% |
| Commercial | 5.5% | 18.57% |
| Transactional | 1.2% | 13.94% |
| Navigational | 0.1% | 10.33% |
Download CSV (CC BY 4.0)
Both columns measure the same thing, the share of AI Overview queries by intent, so why do they disagree? Ahrefs' four shares add up to 106.7% (99.9 + 5.5 + 1.2 + 0.1) because its labels overlap: a keyword can carry several intents.
Semrush's study page doesn't say how it labels intent, and its informational share fell from 91.3% in January to 57.1% in October. Neither column is a trigger rate inside an intent. Quote the vendor and the month with either, and don't set the two informational shares side by side as if they were one definition.
The rate inside each intent comes from the same Ahrefs data. An AI Overview showed on 21.4% of informational SERPs, 4.3% of commercial, 2.1% of transactional and 0.9% of navigational ones, against a 20.5% baseline. Informational queries are 99.9% of AI Overview keywords, yet 21.4% of informational SERPs show one.
Industry
Both studies put Science first, with Shopping and Real Estate last, so the ranking holds while the levels do not.
| Industry | Ahrefs, share of keywords (September 2025) | Semrush, share of keywords (November 2025) |
|---|---|---|
| Science | 43.6% | 25.96% |
| Health | 43.0% | Outside the top three; among the largest decreases since March |
| People & Society | 35.3% | 17.29% |
| Computers & Electronics | Not in Ahrefs' highlighted list | 17.92% |
| Shopping | 3.2% | Under 3% |
| Real Estate | 5.8% | Under 3% |
Download CSV (CC BY 4.0)
Science reads 43.6% in Ahrefs and 25.96% in Semrush because the keyword bases differ. Ahrefs' Science share is 13.6 times its Shopping share (43.6 / 3.2). Semrush adds that Food & Drink grew fastest since March 2025, at +7.25%.
A keyword set's AI Overview exposure is mostly its phrasing, intent and industry mix. That is why panels of short, trending or navigational queries read low, and informational-heavy or science and health sets read high. If you want the strategy side of this, our guide to AI Overviews impact on SEO picks up where these tables stop.
What does a Google AI Overview look like?
A typical AI Overview is short: Pew's median is 67 words and Surfer's mean is 157, and that gap mixes a median with a mean and two different samples. Four questions cover the rest, each answered first.
How long are AI Overviews?
Pew's median AI summary was 67 words, ranging from 7 words to 369. Surfer's mean across 405,576 AI Overviews is 157 words, about 984 characters, with 99% under 328 words.
The 157-word average and the 99% under 328 words come from Surfer's 405,576 AI Overviews (English queries only). One roundup credits them to Semrush; the primary study is Surfer's. Pew's 67-word median sits below that mean (157 / 67 is 2.3 times), but the studies also differ in sample and period. Quote a mean or a median, and name the sample with either.
How many sources do they cite?
In Pew's panel, 88% of AI summaries cited three or more sources and 1% cited a single source. Surfer's mean is 5 sources per Overview, with 90% listing 8 or fewer and 99% of sources referenced once per answer.
Our own median is 7 cited sources per Overview. The counts differ because each tool decides what counts as a source: ours is the cited links as captured on the page.
What format and size?
AI Overviews usually carry a list. In Surfer's data 61% contain an unordered list, 12% an ordered list and 6% both, while 21% contain none, so 78% carry at least one.
BrightEdge puts the average height above 1,200 pixels, taller than a roughly 900-pixel desktop viewport, so the average Overview fills more than the whole visible screen before you scroll. Semrush found Google Ads at the bottom on 25% of AI Overview SERPs, against under 1% in March 2025.
How accurate are they?
One preprint (arXiv 2605.14021) split AI Overview answers into 98,020 atomic claims and checked each against the pages the answer cited. It found that 11.0% of claims lacked support in those pages, mostly through omission.
It is not peer reviewed, so treat it as one measurement. For the "is Google's AI Overview bad" question it gives a measured answer: most claims were supported, and about one in nine was not.
How much do AI Overviews reduce clicks?
The Google AI Overview click-through rate drops 47% in Pew's panel and 58% for position one in Ahrefs' data, but a Semrush before-and-after on the same keywords found the zero-click rate fell. The studies measure different things, so the answer depends on your question.
The studies side by side
The table runs oldest first, and every row names its method, because the method is why the results differ. For the cross-topic picture beyond AI Overviews, see our AI SEO statistics roundup.
| Study | Window | Method | Sample | Result |
|---|---|---|---|---|
| Ahrefs, April 2025 post | Year-over-year, data to March 2025 | Keyword cohorts, position one against a forecast baseline | 300,000 keywords | 34.5% lower position-one CTR |
| Amsive | Published 16 April 2025; no data window stated on its page | Keyword-level CTR on 10 websites | 700K keywords in 5 industries; 10K AI Overview keywords already ranking organically | Overall -15.49%; branded +18.68%; non-branded -19.98% |
| BrightEdge press release | Since May 2024, released 14 May 2025 | Aggregate tracking | Not stated in the quoted line | Impressions up over 49%, click-throughs down nearly 30% |
| Pew | March 2025 searches | Browsing panel | 900 US adults | 8% of visits clicked a traditional link with a summary against 15% without (46.7% lower); 1% inside the summary; session ended on the results page 26% against 16% |
| Semrush | January to October 2025 | Same keywords before and after, Datos clickstream | 200,000+ keywords | Zero-click rate 33.75% to 31.53% |
| Seer, September 2025 study | June 2024 to September 2025 | Client Search Console data | 3,119 terms, 42 organizations | AI Overview queries' CTR 1.76% to 0.61% |
| Ahrefs, December 2025 re-run | December 2023 vs December 2025 | Same design as the April 2025 post | 300,000 keywords | Position-one CTR 58% lower than forecast; raw CTR 0.073 in December 2023 and 0.016 in December 2025 |
| Seer, April 2026 study | January 2025 to February 2026 | Organic CTR by citation status | 53 brands, 5.47M queries | CTR on AI Overview queries about 3.2% in January 2025 to 2.4% in February 2026, about 25% lower; floor of 1.3% in December 2025; uncited brands' CTR fell 67% over 2025; queries with no AI Overview 2.8% to 3.8% |
Download CSV (CC BY 4.0)
Seer's per-million click figures are informational queries only, so don't set them beside the all-query 2.4%. Two rows also deserve a second look. Ahrefs' 34.5% and 58% are one design at two dates, so the second row supersedes the first. And Amsive's branded and non-branded keywords move in opposite directions, so a site-wide average hides both.
Amsive's average also moves with position and page layout. Keywords ranking outside the top 3 lost 27.04% of CTR, and keywords that triggered both an AI Overview and a Featured Snippet lost 37.04%, the largest drop in its data. Its page states no data window.
Links inside the summary return one seventh of the lost clicks
Pew counts 8% of visits with a traditional link click and 1% with a click inside the summary, so visits with a summary yield at most 9 link clicks per 100 against 15 without. It is an upper bound because one visit could carry both clicks.
Links inside the summary give back at most 1 of the 7 lost clicks, about 14% (1 / (15 - 8)). In-summary links return one seventh of what the summary removes.
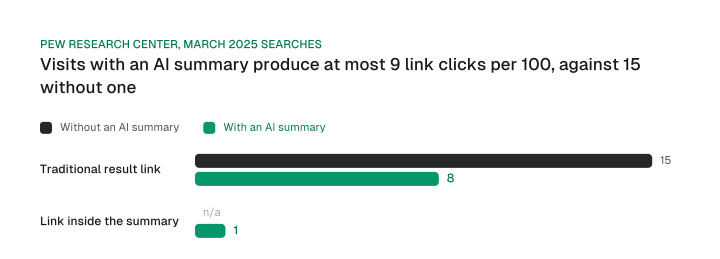
A naive whole-search effect from Pew alone is 8.4% of all clicks (18% of searches times the 46.7% drop). Treat that as an upper bound too, for the reason in the selection section below.
Cited brands kept 62% of no-AI-Overview clicks, uncited brands 28%
On informational queries, Seer counted about 9,445 organic clicks per million impressions for an uncited brand, about 20,743 for a cited brand and about 33,500 where no AI Overview showed.
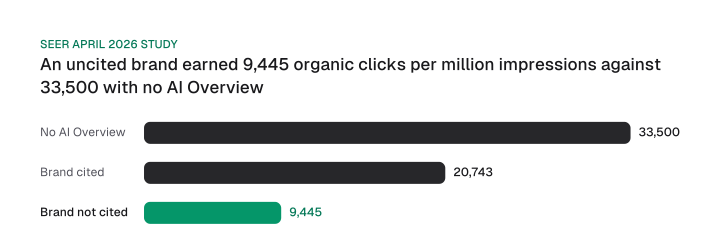
The arithmetic on those figures (our division):
- A cited brand earns 2.2 times the clicks of an uncited one (20,743 / 9,445).
- An uncited brand kept 28.2% of the no-AI-Overview clicks and lost about 72% (9,445 / 33,500).
- A cited brand kept 61.9% and lost about 38% (20,743 / 33,500).
- Clicks lost per million impressions are 24,055 for uncited brands against 12,757 for cited ones, so the cited group's loss is 47% smaller.
Read this as an observed difference, never as "citation wins back clicks". Seer's own text says cited brands' click-through rates held comparably well to uncited brands' until a steep fourth-quarter drop-off, and that it does not attribute changes in the cited bucket to Google alone. The table shows who kept clicks. It cannot show that the citation produced them.
Seer's monthly table by citation status shows the same split. Cited brands' organic CTR on AI Overview queries went from 3.04% in January 2025 to 0.95% in December 2025, and uncited brands' from 1.65% to 0.55%. Both December values sit below the 1.3% all-query floor because the table covers informational queries: its no-AI-Overview column matches Seer's informational-only line.
Seer's September 2025 study, on informational and educational queries, gives the Q3 2025 average: a cited brand's organic CTR was 0.70% against 0.52% uncited (35% higher), and its paid CTR 7.89% against 4.14% (91% higher). Seer says it cannot definitively prove that citation causes higher CTRs.
Part of the gap is selection
Google says an AI Overview appears only when it is additive to classic Search, so the queries that get one differ from the queries that don't. Seer's own September 2025 data show it: in June 2024 the AI Overview queries earned 1.76% against 2.74% for the rest, a 35.8% lower CTR, and by September 2025 the shortfall was 62.3% lower (0.61% against 1.62%).
So more than half of the later shortfall was already there in the first month of data. Seer assigns the label retroactively from the latest snapshot, so the pattern may reflect which queries were bound to get an Overview and may not say anything about causation either way. For you, it means any before-and-after on your own keywords starts with a gap that the Overview did not cause.
Seer's rebound line mixes two studies
The circulating Seer line pairs a floor of 0.61% with a later 2.4%. Those come from two Seer studies, each with a different cohort.
The September 2025 study covers 42 organizations, looks at informational queries, and ends at 0.61%. The April 2026 study covers 53 brands, hits a floor of 1.3% in December 2025 and reaches 2.4% in February 2026, a rise of about 85%. So the 2.4% is no recovery from 0.61%: the two numbers were never one series.
Which CTR number to quote
Each question has one study that measured it. Use Pew for how people behave, Ahrefs for position one, Seer for cited versus uncited, and Semrush for same-keyword before and after; each study answers a different question, and the last column says what you do not use it for.
| Question | Use this study | Why | Do not use it for |
|---|---|---|---|
| What share of visits click a link? | Pew (March 2025) | A panel records real visits with and without a summary | Position-one loss or a site-wide trend |
| How much does position one lose on keywords you rank for? | Ahrefs (December 2025) | One design repeated at two dates on 300,000 keywords | A share of all clicks, since it covers position one only |
| Do cited brands lose less than uncited ones? | Seer (April 2026) | Splits informational queries by citation status, per million impressions | Proof that a citation causes clicks |
| Does the same keyword's zero-click rate change? | Semrush | Same keywords before and after, with clickstream data | Organic CTR, since it measures zero-click sessions |
| Which way is the site-wide trend? | BrightEdge press release | Aggregate tracking since May 2024 | Per-keyword effects or a causal claim |
The loss is real and its size depends on the question. More than half of Seer's later shortfall predates the Overview in its own data, and cited brands lost a smaller share of clicks than uncited ones (38% against 72%) without the data showing that citation caused the difference.
Which pages do AI Overviews cite?
Between 17% and 76.10% of AI Overview citations also rank in the top 10, because the studies differ in match unit, rank cutoff and what counts as the original SERP. The table sorts seven readings by unit and cutoff.
| Study | Window | Match unit | Rank cutoff | Share |
|---|---|---|---|---|
| Ahrefs | July 2025 | URL (1.9M citations from 1M Overviews, top 3 citations each) | Top 10 | 76.10% |
| Ahrefs | March 2026 | URL, all SERP blocks (863K keywords, 4M URLs) | First 10 blocks | 37.9% |
| BrightEdge | September 2025 | Sources, unit not stated | Any organic rank; top 10 | 54.5%; 16.7% |
| BrightEdge | Report of February 2026; series February to July 2025 | Sources, unit not stated | Top 10; top 100 | about 17%; about 53% |
| Surfer | Page updated September 2026; data window not stated | Sources, unit not stated | Top 10 | 52% |
| arXiv preprint | 13 March to 21 April 2026 | Domains | Page-one results | nearly 30% not present |
| Our capture | 22 September to 1 October 2026 | Domains and exact URLs | Page-one organic as captured, median 8 results, not a fixed 10 | 50.4% domains; 40.7% URLs |
Download CSV (CC BY 4.0)
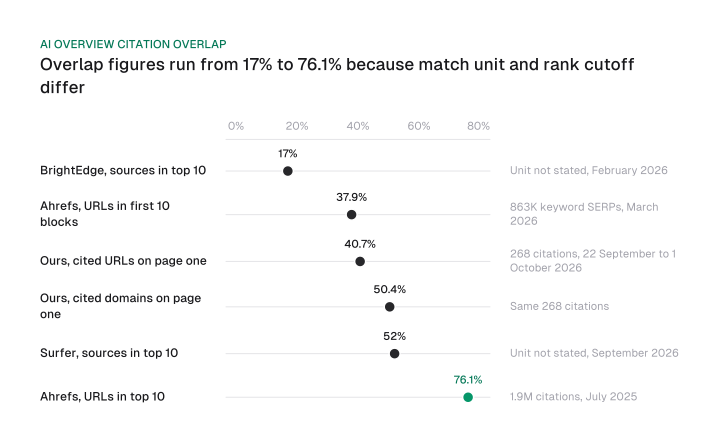
The match unit matters first. On our own capture the same 268 citations read 50.4% by domain and 40.7% by URL, so domain matching runs 9.7 points above URL matching in this capture. A domain match contains every URL match, so domain is never lower.
The 9.7 points describe this capture only, where 268 citations cluster inside 42 Overviews; they don't measure a unit effect across studies. Rows marked "not stated" leave the unit open.
Depth comes second. BrightEdge's 54.5% for September 2025 counts citations at any organic rank, its top-10 figure was 16.7%, and the top-10 reading of about 17% in its February 2026 report sat flat from February to July 2025. Its broader top-100 overlap was about 53%, a gap of 36 points.
So "76.10% to 17%" pairs Ahrefs' top-10 URL figure with BrightEdge's top-10 sources figure, two studies with two units. Even Ahrefs' own re-run (76.10% to 37.9%) came after Ahrefs improved its parsing, so the two are not directly comparable.
The third factor is how Google builds an answer. Its guidance says AI Overviews may use a query fan-out technique, issuing related searches across subtopics and data sources. A citation measured against the original query's top 10 therefore misses pages that ranked for the fan-out subqueries, so overlap studies understate Google's link sources.
That is why the top-100 and domain readings run higher. For the pages that do get cited, Pew found Wikipedia, YouTube and Reddit are the top three sources, making up 15% of AI summary sources against 17% of standard results. .gov websites are 6% of AI summary sources against 2% of standard results.
If you want the tactical side, read how to get cited in Google AI Overviews.
How often do cited sources change?
Cited sources change constantly. Ahrefs followed over 43,000 keywords with at least 16 recorded AI Overviews each over a month. The content changed between observations with a 70% chance, and nearly half, 45.5% of cited sources, were entirely new from one observation to the next.
Every overlap figure above is therefore one snapshot of a set that turns over by about half between observations. Quote an overlap as a reading at a date, with its unit and cutoff.
The two URL-level readings, 76.10% and 37.9%, sit on either side of a parsing change, so read them as two measurements, not one decline.
How many people use AI Overviews, and is Google dropping them?
AI Overviews users number over 2.5 billion a month by Google's own count, up from 2 billion in July 2025, and its July 2026 remarks fold the feature into one Search experience with AI Mode. Three dated facts cover the rest.
- Reach: Google reported over 2.5 billion monthly active users for AI Overviews in June 2026. In its Q2 2025 remarks the figure was over 2 billion monthly users across more than 200 countries and territories and 40 languages.
- Direction: In its Q2 2026 remarks, dated 22 July 2026, Google said it had brought AI Overviews and AI Mode together into one Search experience, and that AI features send billions of clicks to websites every week. The remarks give no denominator, so none of the CTR studies above can confirm or refute the clicks claim. For AI Mode itself, see our Google AI Mode guide, and for its usage and click figures, our AI Mode statistics.
- Control: The opt-out question has a new answer. Google began testing a Search Console control in June 2026 that lets site owners exclude their pages from generative AI Search features, including AI Overviews. Opting out costs all traffic and impressions from those features. The UK test came first; Google's post says that as of 31 August 2026 the features are rolled out to all websites worldwide. The common claim that Google offers no opt out is now out of date.
Once Google reports the two experiences together, AI Overview-only numbers get harder to separate, so date every figure you quote. If you track AI traffic yourself, AI search analytics covers what Search Console shows today.
Reach is large and growing, and the opt-out is now live worldwide at a cost Google states itself.
AI Overviews statistics that circulate but do not hold up
Nine popular AI Overview numbers fail a check against the primary source: some are stale, some mix two studies, some are misattributed. Each row below names the claim as it circulates in roundups, then what the primary page says.
| Number as it circulates | What the primary says | Why it differs |
|---|---|---|
| "AI Overviews grew seven and a half times in 15 months" | 6.49% is Semrush (January 2025); 48% is BrightEdge's tracked queries (February 2026) | Two vendors' sets: a 4.6-fold vendor gap times a 1.6-fold rise inside BrightEdge's set; its own May 2025 release (over 11%) sits about 2.7 times below its roughly 30% tracked figure |
| "Seer's AI Overview CTR hit 0.61%, then rebounded to 2.4%" | 0.61% is the September 2025 study (42 organizations); 2.4% is the April 2026 study (53 brands, floor 1.3% in December 2025) | Two cohorts; the April study's own rise is about 85% from 1.3% |
| "Top-10 overlap fell from 76.10% to 17%" | Ahrefs' 76.10% is URLs in July 2025; BrightEdge's 17% is sources, flat for months; its 54.5% counts any organic rank | Two studies and two cutoffs; Ahrefs improved its parsing between its own 76.10% and 37.9%, so they are not directly comparable |
| "AI Overviews average 157 words (Semrush)" | Surfer's 405,576 Overviews, English only; Pew's median is 67 words | Wrong source, and a mean set beside a median |
| "AI Overviews now appear on nearly half of all search queries" | BrightEdge: about 48% of tracked queries, February 2026 | A vendor's tracked set, not all queries; BrightEdge itself says about 52% of queries trigger no AI Overview |
| "2 billion monthly users" | Over 2.5 billion in June 2026; 2 billion was July 2025 | Stale by a year |
| "13.7% of searches show an AI Overview" | The preprint's 13.7% covers 55,393 trending queries, 13 March to 21 April 2026 | No population stated; a trending-query crawl is not all searches |
| "AI Overviews take 42% of the screen on desktop" | Botify and DemandSphere's report puts AI Overviews at 42% of the desktop screen, from keywords collected in August 2024; BrightEdge's February 2026 pixel height is over 1,200 against a roughly 900-pixel viewport | A 2024 desktop measurement set beside a 2026 pixel reading; the two use different units |
| "Google has no AI Overview opt-out" | A Search Console control entered testing in June 2026, UK subset first; Google's post says it was rolled out to all websites worldwide as of 31 August 2026 | Stale since June 2026 |
Download CSV (CC BY 4.0)
The pattern behind all nine is the same. A number without its window and sample is not a statistic yet, and a trend built from two sources is a comparison of studies. Your move: before you quote any figure from this table, find the study's sample and month.
How we verified these statistics
Every number here was traced to the page that produced it and checked against its sample and date on 1 October 2026. The rules we held to:
- Primary sources only: a study's own page, or Google's, never a roundup.
- One link per statistic, from the source name.
- Derived numbers show their formula in the sentence or the table.
- Preprints are labelled as preprints.
Last verified: 1 October 2026.
Our capture method is simple enough to rerun. We used Chrome, logged out, with gl=us, one capture per unique keyword, and dropped captures with fewer than 5 organic results. Three one-result captures were dropped, and none showed an AI Overview.
The window ran 22 September to 1 October 2026. Page-one organic results had a median of 8 and a range of 5 to 18, so "page one" here means the organic list as captured, which is rarely exactly 10.
The sample is not random. One capture day supplied 18 of the 42 Overviews, and 58 SERPs give an interval of about 60% to 82%. That caveat travels with every number from this set.
You can rerun that method on your own keyword set. AI Overview statistics answer different questions: pick the study whose population matches your claim, state its sample and date, and capture your own keywords before you plan around any rate.
Frequently asked questions
Can I opt out of Google AI Overviews?
Google began testing a Search Console toggle in June 2026 that lets site owners opt out of generative AI Search features, including AI Overviews. Sites that opt out get no traffic or impressions from those features. The test began with a subset of website owners in the UK, and Google's post says that as of 31 August 2026 it is rolled out to all websites worldwide.
What percentage of Google searches have AI Overviews?
It depends on the study and the set of searches. Pew's panel saw an AI summary on 18% of real searches in March 2025, BrightEdge counted about 48% of its tracked queries in February 2026, and a preprint of trending queries found 13.7%. No single rate covers all searches.
Is Google getting rid of AI Overviews?
Google's reporting points the other way. In June 2026 it reported more than 2.5 billion monthly active users for the feature, and in July 2026 it described AI Overviews and AI Mode as one combined Search experience. Future figures may be reported jointly, so date every number you quote.
Do people click links inside AI Overviews?
Rarely. In Pew's panel, 1% of visits to pages with an AI summary included a click on a link inside it. Added to the 8% on traditional links, that gives at most 9 per 100 visits against 15 without a summary, so in-summary links return about one seventh of the lost clicks.
How accurate are AI Overviews?
One preprint checked 98,020 atomic claims against the pages each answer cited, and 11.0% had no support there, mostly through omission. It is not peer reviewed, so treat it as one measurement. Check any single Overview against its sources before you quote it.
Figures and images in this post are free to reuse under CC BY 4.0 with credit to Mission Growth.
Get Mission Growth highlighted in your Google results.