Product Led Growth Explained: Strategy, Metrics, Fit
Product led growth explained: how it differs from sales-led, freemium vs. free trial vs. reverse trial, and the metrics that show it is working.
On this page
Product led growth lets people try the product before they buy it, but that alone doesn't decide whether the model fits your business. One variable does: whether the deal is worth more than it costs to put a dedicated salesperson on it. And two of its most-cited case studies, Dropbox and Slack, get repeated with numbers that don't hold up anymore.
What product led growth means, and whether it's still real
Product led growth hands the job of persuading a buyer to the product itself, instead of to a sales rep.
A prospect signs up, tries it, and that firsthand use does the convincing a sales pitch would otherwise have to do. Marketing, engineering and customer success all act on what a user's in-app behavior shows, rather than waiting on a rep's explanation.
The skepticism around the term is fair: it gets stretched to cover almost anything with a free trial button. But the data says otherwise.
In OpenView's 2022 Product Benchmarks survey, companies identifying as product-led or freemium-led grew from 45% of respondents in 2019 to 55% in 2022, and those companies were about twice as likely to hit 100%+ year-over-year revenue growth than their sales-led peers.
Among the survey's standout performers, 87% formally track an activation metric, a concrete habit built into how those companies report results.
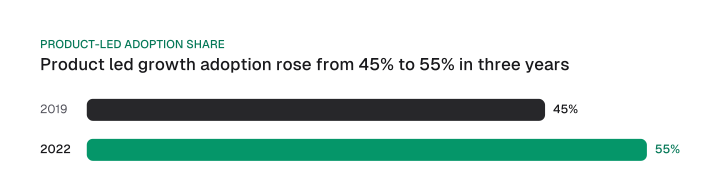
That adoption curve, and the growth-rate gap behind it, is the real answer to whether product led growth is just a buzzword: the model has benchmarked adoption growth and a documented growth-rate edge over sales-led peers.
Product-led growth vs. sales-led growth: how the model actually works
Product-led growth doesn't remove the sales team; it moves usage data in front of intent. It's one specific operating model inside growth marketing, built around that one shift.
Sales, marketing and customer success all act on what a customer's product use already shows, instead of an early-stage sales conversation. That shift is sometimes framed as product-led growth vs sales-led growth, but it doesn't eliminate anyone's job; it changes when a team gets involved and what a rep sees before the first call.
How usage changes what each team does
Under a sales-led motion, a rep has to build the case for the product from scratch on a call. That's the exact friction Salesforce's State of Sales Report, 7th edition, points to: 67% of sellers say their customers need extensive education before they'll buy. Product-led growth front-loads that education into the product itself, so by the time a rep does get involved, the conversation starts from a warmer position.
Three teams pick up the usage data differently:
- Marketing spends less time on collateral and more time watching what qualified users do inside the product.
- Customer success shifts from onboarding calls to reading usage for expansion and churn signals.
- Sales works from the usage-plus-firmographic signal that flags a product-qualified lead, instead of starting cold.
| Sales-led growth | Product-led growth | |
|---|---|---|
| Who drives change | A rep explains and argues for value | The product demonstrates value through usage |
| CAC / education burden | Higher: reps spend time on the 67% of buyers who need extensive pre-purchase education | Lower: the product carries much of that education before a rep is involved |
| Teams involved | Sales-led, with marketing feeding leads | Product, marketing, customer success and sales all act on usage data |
The deal-size floor that decides fit
Whether your product is ready for PLG comes down to three checks this section already covers: deal size relative to what a dedicated sales rep costs to put on it, the self-serve economics of getting a customer to pay without a rep, and whether a user can reach real value in the product entirely alone.
The clearest of the three is deal size: whether product-led growth replaces or supplements sales comes down to that variable relative to sales-rep cost. The other two, self-serve signup and checkout feasibility and whether a user can get to value without help, matter just as much, not company size or "B2B vs. B2C."
Here's a rough, illustrative way to check that fit, and the first real decision in any product-led growth strategy. Take your fully-loaded sales rep's annual cost, divide it by how many deals that rep realistically closes in a year, and treat the result as a rough floor for deal value.
For example, a rep who costs $150,000 a year fully loaded and closes 40 deals a year needs roughly $3,750 of deal value just to cover their own cost. Treat that math as an illustrative rule of thumb for reasoning about fit, standing in for a citable industry figure that doesn't exist at this level of specificity.
Below that rough floor, putting a dedicated rep on every deal stops penciling out, and a product-led motion has to carry acquisition on its own. Above it, usage signals should feed a sales-assisted motion, sometimes called product-led sales.
That threshold is also why most documented product-led examples are B2B SaaS: self-serve signup is easiest to build for software, and SaaS deal sizes cluster on both sides of that floor. The model itself isn't SaaS-specific; a product that can't be tried without a sales call, or whose average deal size sits well above that floor, simply doesn't have room for product-led growth to carry the funnel alone.
Getting found by the right buyer still matters here. A B2B SEO strategy helps a self-serve product reach the technical buyer who evaluates it alone.
Link building for SaaS builds the visibility that gets a self-serve product in front of that buyer before a sales team is ever involved.
Freemium vs. free trial vs. reverse trial: choosing your PLG model
Freemium, free trial and reverse trial solve the same self-serve problem differently, and the real conversion numbers, not intuition, should decide which one fits a given product.
All three let a prospect use the product before paying. They differ in what they take away, and when.
Freemium vs free trial, by the numbers
Comparing freemium vs free trial conversion numbers directly, instead of guessing, is what actually decides which model fits.
| Model | Mechanism | Free-to-paid conversion | Best-fit audience |
|---|---|---|---|
| Freemium | A permanently free tier, with paid tiers unlocking more | ~5% (median organization, OpenView 2022) | A genuinely useful free tier and an audience large enough that even a low conversion rate produces a healthy paying base |
| Free trial | Full or near-full access for a limited window, then access ends without upgrading | ~17% (average organization, OpenView 2022) | Value that only shows up with full features, where a time limit creates urgency to decide |
| Reverse trial | Full paid-tier access for a fixed window, then automatic downgrade to a free plan if the user doesn't upgrade | Not separately reported | The paid tier's value is the whole pitch, and a permanent free plan still needs to exist for users who don't convert |
Download CSV (CC BY 4.0)
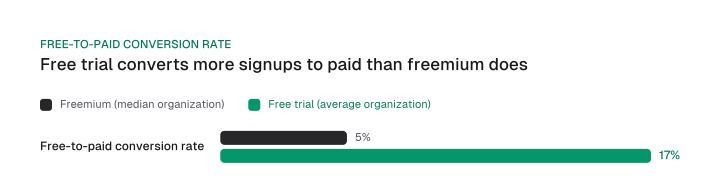
In OpenView's 2022 Product Benchmarks, the median freemium organization converted about 5% of free signups to paid, while the average free-trial organization converted about 17%.
Read each figure on its own terms: a median drawn from freemium organizations, an average drawn from a separate set of free-trial organizations.
The most recent edition of OpenView's Product Benchmarks report no longer publishes this specific freemium-to-trial split; it replaced the static comparison with an interactive calculator. That makes the 2022 figures the most recent citable version of this particular split, even though OpenView has published newer benchmark reports since.
Reverse trial: the deliberate hybrid
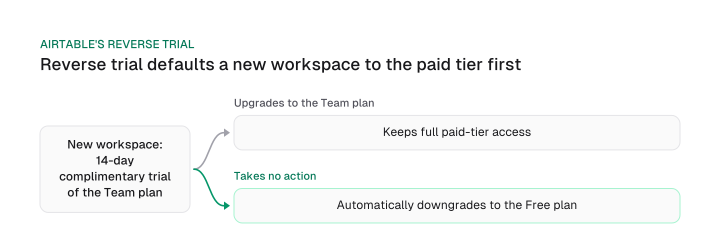
Reverse trial is the deliberate hybrid for products where the value only shows up once someone reaches the paid tier. It doesn't ask a user to imagine what a paid plan would do; it puts them in the paid plan first and lets the downgrade be the thing they choose to avoid.
Airtable runs this model. The first workspace under a new Airtable account gets a 14-day complimentary trial of the Team plan, and at the end of that window it can either stay on the Free plan or upgrade; workspaces added later to the same account don't get the trial.
That automatic downgrade is a structural forcing function freemium doesn't have, because freemium never removes access in the first place. A reverse-trial user has already experienced the paid tier and is choosing to give something up, rather than choosing to add something new.
The PLG metrics that matter
A product-led growth program is only as good as the handful of metrics that prove customers are reaching value.
Each one deserves its own dedicated page rather than a shallow mention here. The right PLG metrics map to one funnel, from a user's first session through to the moment a user first reaches real value (sometimes called the "aha moment"), and on to expansion revenue. The table below puts all seven metrics, their formulas and their funnel stage in one place.
| Metric | Formula | Funnel stage | Go deeper |
|---|---|---|---|
| Time to value | Time from signup to a defined activation event | Onboarding | Time to value |
| Activation rate | Users who reach the activation event ÷ total signups | Onboarding to habit | Activation rate |
| Product-qualified lead (PQL) | Usage-plus-firmographic signal that a user is ready for a sales conversation (no clean formula) | Usage to sales handoff | See FAQ for the full definition |
| Retention rate | Customers still active at the end of a period ÷ customers active at the start | Ongoing usage | Retention rate |
| Free-to-paid conversion rate | Paying customers ÷ total free or trial signups | Monetization | Section above |
| Average revenue per user (ARPU) | Monthly recurring revenue ÷ active paying customers | Expansion | Worked example below |
| Virality (K-factor) | New paying customers referred per existing customer, from invites times their conversion rate | Growth loop | Virality |
Download CSV (CC BY 4.0)
Four of these, activation rate, time to value, the product-qualified lead and virality, already have a full explainer elsewhere on this site, so the table above links out instead of repeating that content.
Here's a worked, explicitly illustrative example: a product-led company with $40,000 in monthly recurring revenue (MRR) and 800 active paying customers has an ARPU of $40,000 ÷ 800 = $50 per customer per month.
Tracked over time, that single number shows whether expansion revenue from existing customers is growing alongside new signups, something a signup count alone can't show.
Track ARPU alongside the other five metrics above. A rising number confirms expansion revenue is genuinely growing, separate from new-signup growth.
How to build a product-led growth strategy in six steps
Implementing product-led growth means sequencing six pieces this guide already covers, in this order:
- Pick the activation event that anchors your activation rate: the moment a new signup experiences the product's core value.
- Choose your free model, freemium, a free trial or a reverse trial, using the conversion table above instead of a guess.
- Instrument time to value so you know how long a signup takes to reach that activation event.
- Define the product-qualified lead signal so usage data flags ready accounts instead of routing every signup to sales.
- Set the full metric roster, from activation through to ARPU, so growth shows up in numbers instead of anecdotes.
- Decide when sales enters, using the deal-size floor above: below it, let the product carry the funnel; above it, feed usage signals to a sales-assisted motion.
Real product-led growth examples
Dropbox and Slack are the two most-cited product-led growth companies, and getting their numbers right matters more than repeating them. Airtable, covered above for its reverse trial, belongs on the same shortlist.
Dropbox's early growth usually gets credited to freemium alone, but the sharpest jump in its history came from one specific event. After Drew Houston's demo video hit #1 on Digg, Dropbox's beta waitlist grew from about 5,000 people to 75,000 in a single day.
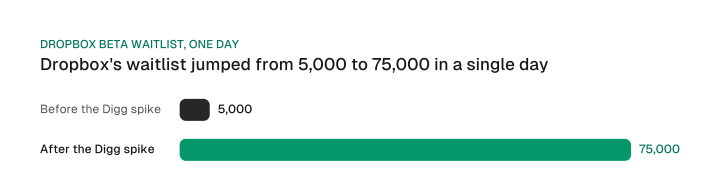
Freemium gave people a reason to want in once they saw the video. The video itself, aimed squarely at Digg's own community, is what put the waitlist in front of that many people at once.
Freemium alone didn't create Dropbox's biggest growth spike. A single demo video, engineered for one community, did.
Slack's numbers get quoted less carefully. Its own FY2021 results, for the period ended January 31, 2021, reported 156,000 total paid customers.
A separate disclosure from October 2019 put Slack's daily active users at more than 12 million. Those two figures are often paired online as though they describe one moment, "12 million users, 156,000 businesses," but the disclosures are more than a year apart and were never reported together.
The correction is a matter-of-fact one: these are two different snapshots of the same company's growth, each tied to its own disclosure date.
Both examples point to the same lesson: a demo video and a paid-customer count don't prove that freemium or a free trial did the work alone. They prove a product-led motion still needs a specific, well-timed growth mechanism behind it.
That mechanism-level thinking carries into product-led SEO too, where the pages a self-serve product ranks for do some of the same job Dropbox's demo video did: get the right audience to the product before a sales conversation starts.
Frequently asked questions
Does product led growth replace sales?
No. Usage data changes when and how sales engages; it doesn't remove the team. A product-led motion feeds usage signals to sales, so a rep's first conversation starts from what the product has already shown.
Does product led growth work outside SaaS companies?
Yes, but it needs a low deal size relative to sales-rep cost and a technically feasible self-serve signup. Most documented examples are SaaS because those two conditions line up there most often.
What is a product-qualified lead?
A usage-plus-firmographic signal that a user is ready for a sales conversation. See the full breakdown, including scoring and routing, at product-qualified lead.
How do I choose between freemium, a free trial and a reverse trial?
Compare the three models on their real conversion numbers, the way the table above does. It lays out OpenView's 2022 freemium and free-trial conversion figures alongside the reverse-trial mechanism.
Is product led growth just a buzzword?
No. Product-led and freemium companies were about twice as likely to hit 100%+ year-over-year growth in OpenView's 2022 benchmark, and adoption grew from 45% to 55% of surveyed companies between 2019 and 2022.
Product led growth is a benchmarked motion with a real decision rule behind it. Whether it fits, which model to run and which metrics to track all follow from the same deal-size and self-serve-fit question.
Start there: check where your average deal sits against a rough per-rep cost floor, pick freemium, a free trial or a reverse trial using the conversion numbers above instead of a hunch, and put the seven-metric scorecard in front of your product team before the next signup cohort lands.
Figures and images in this post are free to reuse under CC BY 4.0 with credit to Mission Growth.
Get Mission Growth highlighted in your Google results.